|
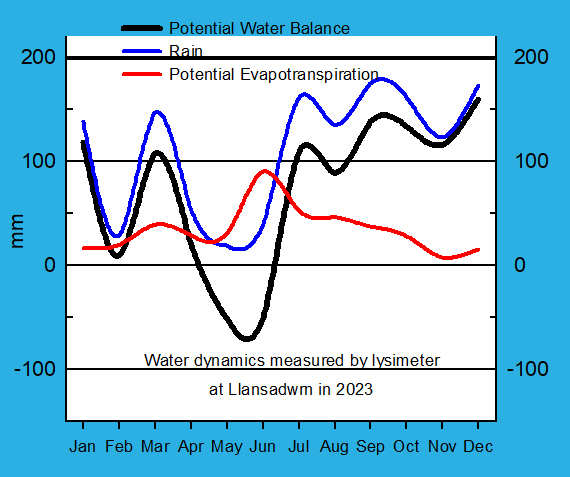
Temperatures well above normal at the beginning, a brief cold spell mid-month, drier with temperatures near normal at the end. The mean temperature 6.2C (+0.6) & [+0.8] of averages was lowest since 2021, but ranked 10th highest in station records that commenced in 1979. The mean maximum 8.6C equal highest since 2020 ranked 8th. The highest maximum 11.7C (-0.4) was on the 10th and the lowest 5.3C on the 19th (+1.4). The highest minimum 9.4C (+0.9) was on the 4th and the lowest minimum -2.4C (-1.2) on the 17th . There were 5 days of air frost over 45.7h duration and 13 (-4.6) ground frosts. The lowest grass minimum was -6.0C (+0.2) on the 19th. In contrast there were no air frosts at Gorwel Heights in Llanfairfechan where the mean temperature was 7.3C (+0.8) & [+1.1] of averages highest since 2020. The mean maximum 9.5C was highest since 2020 and the mean minimum 5.0C lowest since 2021. The highest maximum was 14.3C on the 3rd was lowest since 2021 and the lowest minimum 0.5C highest since 2021. Rainfall in Llansadwrn totalled 137.9 mm (120%) & [133%] of averages largest since 2021 and ranked 27th in records kept since 1928. The wettest day was on the 13th having a modest for January 17.5 mm. There were 4 days without any precipitation and 7 dry days (<0.2 mm). Rain days (>=0.2 mm) were 24 (+1.0); wet days (>=1.0 mm) 18 (+1.6); and days with 5 mm, or more were 11 (+3.3). Rainfall duration (wet hours) were 138h. Rainfall at Gorwel Heights totalled 120.2 mm (114%) & [135%] of averages most since 2021 with the largest 12.8 mm falling on the 10th. Here there were 9 dry days; 22 rain days; 16 wet days; and 11 had 5 mm, or more. Rainfall duration (wet hours) were 123h. Sunshine at RAF Valley was a provisional 66.5h with 8 sunless days. The sunniest day was on the 20th with 7.6h.
February 2023Dry with temperatures well above normal, rather dull and lack of wintry weatherColdest at the beginning with warmer spell beginning of second half The mean temperature 7.2C highest since 2019 (+1.3) & [+1.6] of averages ranked 3rd highest in station records began in 1979. The mean maximum 9.6C ranked 7th (+0.9) & [+1.2] of averages, the highest 13.6C was on the 14th and the lowest 7.1C on the 22nd. The mean minimum 4.8C was (+1.7) & [+2.0] of averages. There were no air frosts, but 13 (-2.3) ground frosts with the lowest -5.0C on the 6th. At Gorwel Heights in Llanfairfechan the mean temperature was 8.2C (+1.7) & [+2.1] of averages was highest since 2019. The mean maximum 10.4C was lowest since 2021 with the highest 16.1C on the 14th highest since 2019. The mean minimum 6.0C was highest on record since 2011 with the highest 10.1C on the 18th equal highest since 2019. The lowest 2.2C on the 6th lowest since 2019. It was the driest February on record at Gorwel Heights with 15.4 mm (18%) & [21%] of averages. The wettest day was on the 20th with just 2.8 mm. There were only 22 h rainfall duration and 5 wet days. Similarly in Llansadwrn rainfall 28.7 mm (26%) & 32%] of averages lowest since 2009 ranked 13th lowest in records back to 1928. The wettest day on the 15th had 9.8 mm. There were 11 days with no precipitation; 17 rain days; and 8 wet days.
A fairly dull month with 69.7 h of sunshine recorded at RAF Valley (81%) & [89%] of averages. The sunniest day was on the 13th with 8.6h and there were 6 sunless days. Winter 2022/23Winter was warmer than average the mean temperature 6.1C (+0.0) [+0.6] lowest since 2021 but ranking 10th highest in station records. Rainfall 35.0 mm was well below the average of the last 10-y (85%) and just above [102%] ranking 32nd largest in Llansadwrn records since 1928.
March 2023A dull and wet month with some snowA spell of wintry weather before the middle of the month, a wet and windy beginning the second half. A spell of wintry weather 7-11th with snow each day at the weather station and gave lying snow at 0900 GMT on the 10th, the first in four years the last was in January 2019. The 5 days with snow was the most in March since 2018 (6). A wet month, particularly at Gorwel heights in Llanfairfechan, where 155.2 mm fell, third highest in March since 2011, (164%) & [187%] of averages. The wettest day on the 9th had 31.0 mm, there were 169 h rain duration with 11 days recording 5 mm, or more. Rain days numbered 25 and wet days 20, but there were 6 dry days. In Llansadwrn rainfall was 146.6 mm (161%) & [187%] of averages, largest since 2019 ranking one of the 6 wettest Marches since 1928. The wettest day was on the 12th having 22.8 mm. Four days had no precipitation; 5 days were dry. Rain days numbered 26 (+8.6); wet days 21 (+8.1); and 8 days (+2.0) had 5 mm, or more. Rainfall duration was 175 h. With four days of air frost most since 2019, but way behind the 14 in March 2013, the mean minimum was 7.1C (+0.3) & [+0.5] of averages and lowest since 2020. The lowest minimum was -1.6C on the 8th. Maxima were lowest the mean 9.8C (-0.1) & [-0.4] and the highest 14.2C on the 17th was (-1.9), the lowest maximum 3.6C on the 8th was (-1.0). The monthly mean 7.1C lowest since 2020 was close to averages (+0.3) & [+0.1] ranking 22nd lowest since 1979. At Gorwel Heights the mean maximum was 10.4C with the highest 16.9C on the 29th lowest since 2018. The mean minimum 5.2C the lowest 0.0C on 11th so no air frost was recorded, the highest 10.4C was on the 17th with 10.0C on the 21st. The monthly mean 7.8C (0.4) & [0.2] of averages. Sunshine at RAF Valley was a provisional 85.6h lowest since 1998 and 9th lowest on the Anglesey record since 1931. There were 9 sunless days, but the sunniest on the 27th had 8.4h.
April 2023A fairly average month with fewer ground frosts than usual and no very heavy rainAverages hid a mixture of fine and wet days, a wintry day on the 12th and spells of dry sunny weather on the 17-20th and 24-26th.Temperatures were a little above the averages the mean 9.4C (+0..2) & ]+0.3] lowest since 2921 ranked 16th highest in station records since 1979. The mean maximum was 13.2C with the lowest 8.8C on the 12th and the highest 19.1C on the 29th . The mean minimum was 5.5C with the lowest 1.6C on the 25th followed by the highest 10.2C on the 30th. There were only 2 ground frosts 6.3 days below average, the lowest was -1.7C on the 3rd and -0.8C on the 25th. At Gorwel Heights the mean temperature was 9.9C lowest since 2021. The highest maximum 18.0C was on the 30th and the lowest 8.0C on the 12th. The highest minimum was 10.5C on the 30th and the lowest 3.1C on the 30th. Rainfall was 53.0 mm (118%) & [81%] of averages most since 2019. The wettest day was on the 12th with just 9.2 mm. Days with no precipitation numbered 13 (-0.9) and dry days were 14 (-2.6). Rain days were 16 (+2.6); wet days 10 (+0.4); and 5 days had 5 mm or more (+1.9). At Gorwel Heights 68.2 mm of rain fell with the wettest day on the 11th having 14.2 mm. There were 15 dry days and 15 rain days. Wet days were 13 and 6 had 5 mm, or more. Rainfall duration (wet hours) was 72h in Llansadwrn at an average rate of 0.7 mm/ h and 65h in Llanfairfechan at an average rate of 1.0 mm/h. The cold wintry day on the 12th brought hail, sleet and snow in Llansadwrn and snow on the mountains of Eryri. Sunshine at RAF Valley was 166.1h (provisional) least since 2019 (90%) & [101%] of averages. The sunniest day was on the 20th with 13.3h and there were 2 sunless days.
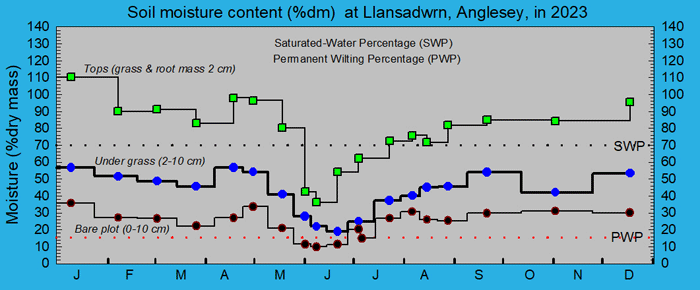
May 2023Very dry, sunny and well above average temperaturesMost of the rain was in the first half of the month, sunniest in the second halfA remarkably dry May with only 18.6 mm the second driest in 96 years, least since 2020 that with 11.9 mm the driest. The wettest day was on the 7th and that had only 6.8 mm. There were 21 days with no precipitation (+9.4) and 23 dry days (+7.9). Rain days were 8 (-7,9); wet days 3 (-8.0); and just 2 (-2.7) had 5 mm, or more. By the 20th of the month bare soil on the uncultivated met plot became cracked and powdery. Temperatures were over a degree above averages with the mean 13.0C, highest since 2017, [(+1.2)] of averages ranked 6th highest in station records since 1979. There was only one sunless day, that was on the 8th. Sunshine at RAF Valley totalled 276.4h (provisional), highest since 2020, and ranked 2nd in Anglesey records since 1931.
Spring 2023
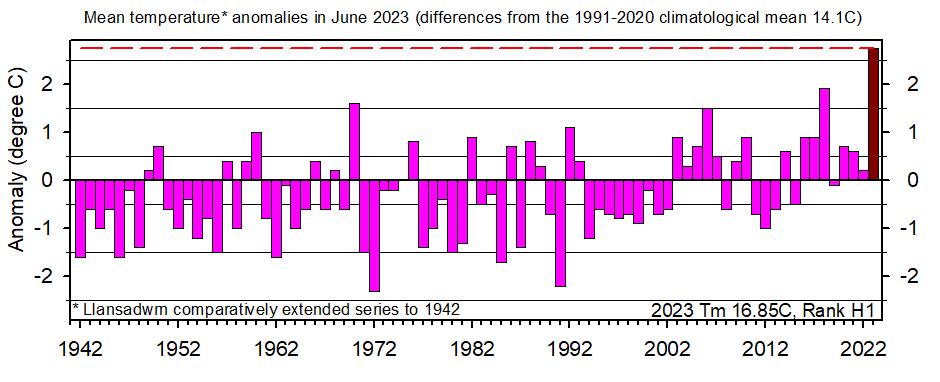
Spring mean temperatures were all about half a degree above the averages. The mean 9.8C was lowest since 2021 and ranked 13th highest in station records since 1979. Rainfall was 218.2 mm, most since 2021, ranked 31st in Llansadwrn records since 1928. June 2023The warmest June on record, sunny and rather dryThe first half was very warm and sunny, the second half just a little cooler . A dry month the 39.1 mm of rain at Llansadwrn (54%) & [53%] of averages was least since 2018 and ranked 16th lowest in records since 1929. There were 13 days (+0.7) with no precipitation; 15 (-1.0) dry days; 15 (-1.0) rain days; 9 (-1.3) wet days; and 2 (-2.6) had 5 mm, or more. Rainfall at Gorwel Heights was 34.6 mm (44%) &[49%] of averages , largest since 2021. It was the second highest June for sunshine on the Anglesey record back to 1931. Thunder was heard in Llansadwrn on 5 days (+4) the second highest of any month on record, the highest is 7 days in June 2020.
July 2023A wet month with near average temperatures and lower than average sunshineCool overall, warmer and drier at the beginning, wetter and cooler at the endRainfall was most since 2020 with 161.0 mm (202%) & [207%] of averages in Llansadwrn, where it was 5th wettest since 1928, and 180.4 mm at Gorwel Heights in Llanfairfechan (202%) & [227%] was most since before 2011. Wettest days were 24.8 mm on the 21st in Llansadwrn and 26.4 mm on the 22nd at Gorwel Heights. Temperatures were close to the averages in Llansadwrn the mean temperature 15.5C lowest since 2020 was (-0.8) & [-0.3] and at Gorwel Heights 16.7C again lowest since 2020 (-0.5) & [0.0]. Warm days were few and far between with 6 days of 20C, or more, with Gorwel Heights doing better with 16 days. Only one day reached 25C, or more, 25.0C on the 7th in Llansadwrn with 26.2C recorded at Gorwel Heights. Sunshine recorded at RAF Valley was 158.3h least since 2020 (75%) & [90%] of averages with 3 sunless days. Sunniest was 12.1h on the 24th.
August 2023Wetter then normal with near average mean temperatures and sunshineWet and windy towards the middle of the monthRainfall was 134.4 mm ranking 15th wettest in Llansadwrn since 1928. Most since 2020 the accumulation was (137%) & [149%] of averages. The wettest day was on the 13th when 28.8 mm fell over 7h duration, the next day 16.8 mm over 4h. The invariably wet 23rd had 19.5 mm spread over 17h duration the highest of the month, the 18th rained over 10h, but had just 6.6 mm. There were, however, 4 days (-4.3) with no precipitation and 8 days (-5.5) dry days. Rain days were 23 (+5.5), wet days 14 (+1.2) and 8 days (3.4) had 5 mm, or more, continuing the climate trend towards more wetter days. It was wetter at Gorwel Heights in Llanfairfechan the 175.6 mm wettest since 2020 the 2nd highest since records began in 2011. The wettest day was on the 18th when 29.4 mm fell and the 23rd had 22.6 mm. There were 10 dry days, 21 rain days, 18 wet days and 11 had 5 mm, or more. Wet hour rainfall duration totalled 108h in Llansadwrn and 120h in Llanfairfechan. Mean temperatures were a little above the averages in Llansadwrn [(+0.2)] and below at Gorwel Heights [(-0.2)]. The mean maximum in Llansadwrn was 18.2C with the highest 24.4C on the 10th and the lowest 15.7C on the 27th. There were 7 warm days 20C, or more, with 3 day spells 9-11th and 15-18th.The mean minimum was 12.8C with the highest 15.8C on the 19th and the lowest 9.3C on the 6th that also had the lowest grass minimum of 6.3C. The mean temperature was 16.9C lowest since 2021 ranked 14th highest in station records since 1979. At Gorwel Heights the mean maximum was 19.5C with the highest 25.2C on the 9th and the lowest 15.3C on the 5th. There were 12 days that reached 20C or more, with spells 9-12th and 17-23rd. The mean minimum was 13.6C with the highest 16.6C on the 19th and lowest 11.1C on the 5th. The mean temperature was 16.5C lowest since 2021 with the highest 20.3C on the 10th. The provisional 164.8h sunshine at RAF Valley was lowest since 2021. The sunniest day was on the 16th with 11.9h, there were 3 sunless days. Summer 2023Summer with 334.4 mm rainfall was most since 2020 (133%) & [139%] of averages ranked 10th wettest in Llansadwrn records since 1928. Temperatures were lowest since 2021, but the mean 15.9C ranked 14th highest in station records since 1979.
September 2023Warmest September on record also a wet one with near average sunshineRemarkable heat at the beginning, heavy rain in the middle with storms towards the end Temperatures were highest on record in Llansadwrn since 1979 and Llanfairfechan since 2011 by a shockingly large margin. The first half of the month had temperatures an unprecedented 5C above averages, the mean maximum 22.4C in Llansadwrn ran (+5.2) & [+5.1]. The spell of 5 days 4 to 8th in Llansadwrn had 20C, or more, each day and at Gorwel Heights similarly a spell of 9 days 2 to 10th. The month ended with a mean temperature in Llansadwrn of 16.4C, highest since before 1979, was [(+2.4)] of averages. The mean maximum 19.7C highest since 2007 (20.0C) rank 2 with the highest 27.3C on the 8th and the lowest 14.7 on the 22nd. The mean minimum 13.2C highest on record was (+2.2) & [+2.5] of average. The highest minimum 18.5C was on the 8th and the lowest 7.5C on the 23rd that also had the lowest grass minimum reading 3.2C (+0.5). The mean temperature at Gorwel Heights was 17.2C the highest 23.3C on the 7th. The mean maximum 20.1C was highest on record with the highest 26.6C on the 4th and lowest 13.1C on the 22nd. The mean minimum was 14.3C with the highest 20.4C on the 7th and the lowest 9.9C on the 23rd. Despite the heat and dryness at the beginning of the month total rainfall at Gorwel Heights ended the month over 200% above average with 216.4 mm most on record beating the 213.2 mm that fell in 2012. The highest daily falls were on the 11th with 48.2 mm, not quite getting to the 51.6 mm recorded in 2018, and 40.8 mm on the 17th. Eleven days had 5 mm, or more, and rainfall duration was 149 wet hours. Not quite so wet in Llansadwrn where 174.7 mm fell, largest since 1976 38-years, (186%) & [172%] of averages. The largest fall was on the 17th and the 3 days 17 to 19th had 66.8 mm. Days with no precipitation numbered 5 (-4.3) and dry days were 11 (+1.7). Rain days were 19 (+1.8); wet days 18 (+5.8); and there were 13 days (+6.8) with 5 mm, or more, continuing the climate trend for more heavier rainfalls. .... Sunshine was a little above average with a provisional 144.1 hours recorded at RAF Valley, highest since 2020.
October 2023Wet and stormy temperatures above average very dull at timesMost rain was associated with named storm Babet in middle of month Rainfall of 161.2 mm (110%) & [125%] while least since 2018 ranked 22nd largest of the 96 October records in Llansadwrn since 1928. The largest fall was on the 18th with 33.4 mm, the 3-days 18-20th having 64.4 mm. The 11-12th had 33.2 mm between them with 17.8 mm on the 5th. Despite the rainfall total there were 6 days with no precipitation and 7 dry days (-2.8). Rain days were 24 (+2.8); Wet days 18 (+1.9) and 8 days (-0.5) had 5 mm, or more. Gorwel Heights in Llanfairfechan had 193.6 mm (139%) and [154%] of averages most since 2021, the wettest day 43.8 mm on the 20th. The 10-12th had 68.4 mm. ... Temperatures were above the climatological average the mean 12.4C [+1.3], lowest since 2021, but continuing the heating trend. So much so that the annual mean, with two months to go, is running at a shocking 11.9C. Last year the mean was 11.2C highest over the 44-years of station records. The mean maximum 15.2C (+1.1) & [+1.2] ranked 8, the highest 21.4C on the 8th and the lowest 11.3C on the 11th. The mean minimum 9.4C (+0.6) & [+1.4] of averages with the lowest 4.1C on the 15th. There was no frost during the month. The most October ground frosts were in 1997 when there were 9, the average is 1.7. At Gorwel Heights the maximum of 25.6C (RH 38%) on the 7th was a station record, in a 5-day spell 6-10th of 20C, or more. Gorddinog AWS reported 25.2C and the UK highest on the day 25.4C at Heathrow and 23.2C at Usk in Wales were exceeded. The mean maximum for the month was 15.8C, the lowest 10.6C on the 18th. The mean minimum was 10.6C and the lowest 6.5C on the 15th. The mean was 13.2C (+0.8) & [+1.3] of averages with the highest daily means 16.1C on the 7th and 16.2C on the 8th. Sunshine at RAF Valley was provisionally 94.3h least since 2021. Sunless days were 8 at Valley, but in Llansadwrn there were only 4 with advantageous lee-breaks occurring in an unusually high number of 10 days with an easterly component in the wind direction. The 5 days with a SE wind recorded at 0900 GMT was particularly unusual. Gorwel Heights recorded 9 SE'ly days. At Gorwel Heights relentless high SE'ly winds off the mountains occurred on the 17th when a wind run of 492 miles was recorded. The mean wind speed was 20.9 mph with a maximum of 31.9 mph, highest gusts recorded were 46 mph on both the 17th and 18th. In contrast the wind run in Llansadwrn on the 17th was only 45 miles with a mean wind speed of 2.1 mph and highest gust of 21 mph
November 2023A very dull month with close to average temperaturesHail showers at the beginning, mild and wet for most of the month before turning cooler and wintry at the end Temperatures were a little above the climatological average the mean 8.1C [+0.2], lowest since 2019. Despite moderate November temperatures, the mean -0.4 based on the decadal average, nevertheless the annual mean, with one month to the end of the year, at 11.6C is still running above average. Last year the mean was 11.2C highest over the 44-years of station records. The mean maximum was 10.4C (-0.9) & [0.0] ranked 21 out of 45-years, the highest 13.6C on the 19th and lowest 4.8C on the last two days the 29th and 30th when turning colder and more wintry, lowest since 1996 ranked 5th lowest since 1979. The mean minimum 5.9C (+0.1) & [+0.4] again lowest since 2019 ranked 15th highest. The lowest 0.3C (-0.8) was on the 29th so no airfrost in the month. There were 8 days of ground frost, near average (+0.2), the first was on the 3rd -0.2C with the lowest -2.5C on the 25th a bit above average (+0.8). There have been 192 days frost-free since the last ground frost of -0.8C on the 25th April. At Gorwel Heights the mean temperature was 9.0C (-0.2) & [+0.3] of averages, lowest since 2019, the highest 11.7C on the 19th. The mean maximum was 10.8C with the highest 15.5C on the 17th, lowest since 2017, and the lowest maximum 4.2C on the 30th was lowest on record since 2011. The mean minimum was 7.2C with the highest 11.1C on the 19th and the lowest 1.1C on the 30th so no frost was recorded. Rainfall in Llansadwrn was below average the 122.6 mm (89%) & [92%] of averages, but was above average at Gorwel heights the 145.2 mm (117%) & [118%] largest since 2021. Largest falls were 12.8 mm on the 9th in Llansadwrn and 39.4 mm on the 1st at Gorwel. In Llansadwrn there were 4 days with no precipitation (+1.0) and 5 dry days (-2.3). Rain days were 25 (+2.3); wet days 19 (+1.7); and days with 5 mm, or more, were 11 (+2.1). At Gorwel there were 7 dry days; 23 rain days; 18 wet days; and 12 had 5 mm, or more. On the whole it was a pretty dull month with 10 sunless days. At RAF Valley sunshine was 44.3h (provisional), lowest since 2015, with the sunniest day 4.3h on the 15th. This ranks the 20th lowest sunshine on the Anglesey record since 1931.
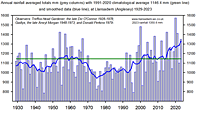
Autumn 2023The mean autumn temperature 12.3C ranks fourth highest in station records (since 1979) and was equal highest since 2006 Rainfall of 458.5 mm just 1.1 mm less that last year 2022, least since 2020, was eleventh largest in Llansadwrn records since 1928.
December 2023Warm wet and stormy. Very dull with 15 sunless daysThe beginning was cold with air and ground frost. Thereafter mild, wet and windy with a super thunderstorm towards the end The first two days were cold with 22.2h of air frost minima -1.8C and -1.9C on the 1st and 2nd. It became mild on the 6th and there followed 20 days with maxima 10C, or more, mostly in two spells spells 6-11th and 20-28th with the highest 12.8C on the 27th. Nothing unusual in that except the origin of the air was warm from tropical regions. The mean maximum was 9.8C (+0.6) & [+2.0C], highest since 2018 and 4th highest in station records. The mean minimum was 5.5C (+1.0) & [+2.0], again highest since 2018 and ranking 4th. The mean was 7.7C (+0.9) & [+2.0] also highest since 2018 ranking 4th. The mean temperature at Gorwel Heights, Llanfairfechan was 8.6C, highest since 2016, (+0.8) & [+2.2] of averages. The mean maximum was 10.8C, highest since 2016, rank 2nd with the highest 14.3C on the 27th, lowest since 2017, and the lowest 5.1C was on the 1st was lowest since 2019. The mean minimum was 6.4C, lowest since 2018, with the lowest 0.2C on the 2nd, highest since 2021. The highest minim was 10.6C on the 18th, highest since 2021. It was a wet month, but not particularly unusual in Llansadwrn. Rainfall was 172.8 mm (103%) & [127%] of averages, largest since 2020 and 16th largest in December since 1928. The wettest day was on the 12th with 17.6 mm and there was just one day (-1.7) on the 1st with no precipitation, and two dry days (-4.4). Rain days numbered 29 (+4.4); wet days were 23 [+3.2]; and 14 days (+3.4) had 5 mm, or more, continuing the increasing trend. It was wetter at Gorwel Heights where rainfall totalled 196.0 mm (122%) & [158%] of averages, wettest since 2020. The wettest day was on the 4th with 27.2 mm. There were 5 dry days ( with <0.2 mm falling); 26 rain days (>=0.2 mm); 22 wet days (>=1.0 mm); and 16 days had 5 mm, or more. A rather dull month and often with thick cloud it was quite dark at times at midday, maximum 23W on the 19th. There were c.28.0h of sunshine at RAF Valley, lowest since 2018 and the 9th lowest on the Anglesey record since 1931. The sunniest day was on the 1st with 6.1h when the month's most solar radiation 4.21 MJ m -2 was recorded in Llansadwrn, and there were 14 sunless days, 15 in Llansadwrn. The least sunshine was recorded on Anglesey by the Holyhead Coastguard in 1931, just 15.5h using their Campbell-Stokes Instrument. Corrected equivalent to modern day Kipp & Zonen instrumental records it was 14.4h.
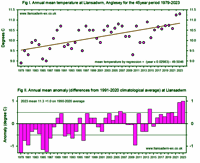
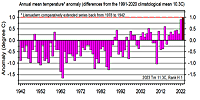
Annual 2023In Llansadwrn it was the warmest recorded at the station over 45-years. It was the second warmest year on record in Britain and the warmest in Northern Ireland. .
| |||||||||||||||||||||||||||||||||||||||||||||||||||||||||||||||||||||||||||||||||||||||||||||||||||||||||||||||||||||||||||||||||||||||||||||||||||||||||||||||||||||||||||||||||||||||||||||||||||||||||||||||||||||||||||||||||||||||||||||||||||||||||||||||||||||||||||||||||||||||||||||||||||||||||||||||||||||||||||||||||||||||||||||||||||||||||||||||||||||||||||||||||||||||||||||||||||||||||||||||||||||||||||||||||||||||||||||||||||||||||||||||||||||||||||||||||||||||||||||||||||||||||||||||||||||||||||||||||||||||||||||||||||||||||||||||||||||||||||||||||||||||||||||||||||||||||||||||||||||||||||||||||||||||||||||||||||||||||||||||||||||||||||||||||||||||||||||||||||||||||||||||||||||||||||||||||||||||||||||||||||||||||||||||||||||||||||||||||||||||||||||||||||||||||||||||||||||||||||||||||||||||||||||||||||||||||||||||||||||||||||||||||||||||||||||||||||||||||||||||||||||||||||||||||||||||||||||||||||||||||||||||||||||||||||||||||||||||||||||||||||||||||||||||||||||||||||||||||||||||


