|
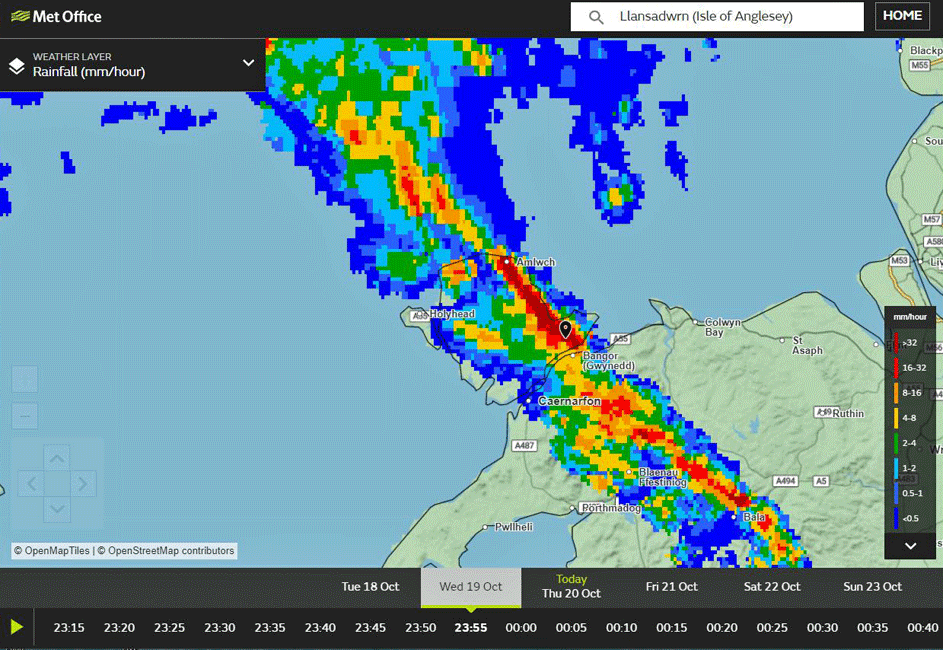
Very warm and wet to start then a spell of wintry weather before a fine drier spell ending with a few sunny and warmer days Rainfall was below average the 62.8 mm (54%) & [61%] of averages least since 2019 was ranked 16th lowest in Llansadwrn records since 1928. The largest fall was 15.8 mm on the 1st and the 21 mm over wet days 6-8th on saturated ground was sufficient to produce local flash flooding on the 8th. There were, however, 8 days (+4.9) with no precipitation with a 6 day spell 20-25th when with cloudy skies it was rather dull. There were 13 (+5.1) dry days (<0.2 mm); 18 (-5.4) rain days (>=0.2 mm); 11 (-6.0) wet days (>=1.0 mm); and 4 days (-3.9) having 5 mm, or more. Drier than usual too at Gorwel Heights, in Llanfairfechan, where 53.6 mm fell (58%) & [60%] of averages least since 2017 (38.6 mm). Here there were 13 dry days; 18 rain days; 15 wet days; and 5 had 5 mm, or more. Rainfall duration (wet hours) at Gorwel Heights was 74h and in Llansadwrn 79h with average rainfall per hour of 0.8 mm and 0.7 mm respectively. The first of the month was wet, warm and windy. Maximum temperatures were 14.4C at Gorwel Heights and 12.8C Llansadwrn, highest of the month. The mean maximum for the month in Llansadwrn was 8.6C (+0.8) & [+0.7] of averages highest since 2016 ranked 8th in records since 1979. The lowest maximum was 4.2C on the 24th and the mean for the month 4.0C (+0.8) & [+1.1] of averages. The mean temperature 6.3C (+0.8) & [+0.9] of averages highest since 2020 ranked 9th. The highest mean, and the only one in double digits, was 12.2C on the 1st, the lowest 3.5C occurred on the 5th and 24th. At Gorwel Heights the mean temperature was 7.3C (+0.8) & [+1.1] of averages highest since 2020 ranked 3rd in records since 2011. The mean maximum 9.3C highest since 2020 ranked 3rd and the mean minimum 5.2C was equal highest 2020 on record. Despite 8 sunless days it was sunniest at RAF Valley since 2011 with 67.4h (141%) of the decadal average and [119%] of the climatological average. The sunniest day was on the 14th with 7.0h.
February 2021Very mild and fairly sunny with rainfall above historical averagesMild at the beginning, more wintry with three named storms towards the end Overall the month was mild with the mean temperature 6.9C (+1.2) & [+1.3] of averages highest since 2019 ranking 5th in station records since 1979. The mean maximum was 9.6C with the highest 12.1C on the 21st and lowest 5.9C on the 18th, the temperature reached 10C, or more, on thirteen days. The mean minimum was 4.2C and showed the greatest anomaly [+1.4], there were no air frosts the lowest 0.8C (+2.4) on the 11th. There were 10 ground frosts (-5.6), lowest since 2011 rank 10, the lowest -4.1C also on the 11th. At Gorwel Heights in Llanfairfechan the mean air temperature was 8.1C (+1.5) & [+1.9] of averages, highest since 2019 ranking 2 since 2011. The highest maximum was 14.6C on the 16th and there were 19 days that had 10C, or more. The lowest maximum was 5.6C on the 24th. The mean minimum 5.3C lowest since 2019 ranked 4th highest since 2011, with no air frosts recorded the lowest 2.6C on the on the 24th was highest on record at the station. February rainfall 132.9 mm (123%) & [ 147%] was least since 2019, but one of the 13th largest falls in Llansadwrn records since 1928. The were no very large falls the wettest day on the 8th had 15.8 mm. Only 3 days had no precipitation and 6 (-3.3) were dry <0.2 mm. Rain days were 22 (+2.9); wet days were 16 (+2.7); and days with 5 mm, or more, were 14 significantly (+7.4). Rainfall duration (wet hours) was 148h with an average rate of fall of 0.9 mm per hour. It was wetter at Gorwel Heights that had 144.4 mm (170%) & [193%] of averages, most since 2020 and second largest on record. The wettest day was on the 5th having 17.4 mm. There were 6 dry days, 22 rain days; 16 wet days; and 11 had 5 mm, or more. Rainfall duration (wet hours) was 129h, with an average rate of fall of 1.1 mm per hour. Sunshine at RAF Valley was the lowest since 2017, the 76h (91%) & [97%] of averages. Sunniest was the 27th with 8.8h and there were 7 sunless days. Winter 2021/22Winter temperature averages were highest since 2019 ranking 3rd in station records since 1979. There were no air frosts in January and February this being a record, with 2 in December 2021 lowest -0.8C. Winter frosts were lowest since 2019/20 when only one lowest on record, this winter then being second lowest on record. Winter rainfall was drier than the last decade (91%) that has been notable for high rainfall events. Compared with the historical 1971-1980 average it was (139%). When compared with the current 1991-2020 climatological average it was [109%] and with the station's long term average 118%.
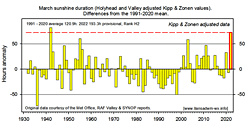
March 2022Driest since 1993, second warmest on record and sunniest (at Valley) for 80-yearsStormy towards the middle of the month turning wintry at the end. It was the driest March in Llansadwrn records since 1993, ranking 7th since records began in 1928. Rainfall was 29.1 mm (32%) & [37%] of records with the largest fall not even reaching double figures 9.4 mm on the 11th. There were 14 days with no precipitation; 17 dry days; 14 rain days; 9 wet days and just one 5 mm, or more, 5.3 days below the decadal average. Rainfall duration (wet hours) was 61 hours It was wetter again at Gorwel Heights in Llanfairfechan with 45.8 mm (53%) & [55%] of averages, but least since 2014. The wettest day was on the 12th with 12.8 mm. There were 15 dry days; 16 rain days; 7 wet days and 4 had 5 mm, or more. Rainfall duration was 58 hours with a greater rate of fall 0.8 mm/h than Llansadwrn 0.5 mm/h. . It was the second warmest March on record in Llansadwrn with a mean temperature of 8.8C [(+1.7)] of averages. In station records back to 1979 only 2012 had a higher 9.5C mean. The mean maximum was 12.7C [(+2.5)] with the highest 19.8C on the 22nd with the lowest 7.2C on the wintry 31st. The mean minimum was 4.8C [(+1.0)] with the highest 9.2C on the 10th. There was one air frost -1.1C on the 7th lasting just 3.3h, and 8 ground frosts the lowest -4.7C on the 7th. The mean temperature at Gorwel Heights was 9.4C (+1.6) & [+1.8] of averages highest since 2012. The mean maximum was 12.6C highest equal with 2012, the highest maximum was 19.8C on the 22nd and the lowest 7.0C on the 31st. The mean minimum was 6.1C highest since 2017. There were no air frosts with the lowest minimum 1.2C on the 31st. Sunshine at RAF Valley was 193.3h the most since 1942 203h, Kipp & Zonen adjusted values, the highest on the Anglesey record since 1931. The sunniest days this year were on the 18th and 20th each with 11.2h. Eight days saw 10h, or more. There were 2 sunless days.
In Llansadwrn global solar radiation for the month averaged 11.22 MJ m -2 with the brightest day on the 31st having 18.15 MJ m -2. The dullest day was on the 2nd with 2.20 MJ m -2 , there were 4 sunless days.
April 2022Rainfall below averages, temperatures above average with sunshine on average in recent yearsWintery and wettest in first quarter thereafter warm, dry and sunnyRainfall of 36.2 mm (71%) & [55%] of averages was most since 2019, but ranked 20th lowest in Llansadwrn since 1928. The largest fall was only 8.0 mm on the 3rd and here were 16 (+3.3) days with no precipitation. Dry days were 19 (+3.6); rain days 11 (-3.5); wet days 9 (-1.0); and just 3 days (-0.3) with 5 mm, or more. A little more rain at Gorwel Heights, Llanfairfechan, the 40.4 mm (64%) & [53%] of averages most since 2019. The wettest day was on the 4th with 6.2 mm. There were 18 dry days; 12 rain days; 10 wet days; and 4 days reached 5 mm, or more. Rainfall duration (wet hours) was 61h at both stations. The mean temperature in Llansadwrn 9.5C (+0.5) & [+0.4] of averages was highest since 2020 and ranked 12th in station records since 1979. The mean maximum was 13.5C the highest maximum 19.7 was on the 17th and the lowest 8.4C (+0.6) on the 1st. The mean minimum was 5.5C and the lowest 0.1C (-0.7) on the 9th. No air frost, but 6 (-2.6) ground frosts the hardest on the 9th -3.8C (-0.4). At Gorwel Heights the mean temperature was 10.1C (+0.8) & [+0.5] of averages. The highest maximum was 20.8C on the 17th, the lowest maximum 7.0C on the 1st. The highest minimum was 10.1C on the 15th and the lowest 2.5C on the 3rd. Sunshine reported at Valley was provisionally 179.9h least since 2019, but ranked 24th highest on the Anglesey record since 1931. The sunniest days was on the 25th when there were 13.5h, there was only one sunless day at Valley, but three in Llansadwrn. May 2022Just below average rainfall with above average temperaturesChangeable through the monthThe mean temperature 12.7C [(+0.9)] was highest since 2020 and ranked 8th in station records since 1979. The mean maximum was 16.4C (+0.6) & [+0.5] of averages highest since 2018, but ranked only 16th. The highest maximum was 20.8C on the 15 (-1.5) and the lowest 10.9C on the 1st (+0.4). The mean minimum 9.2C was [(+1.3)] with the lowest 6.0C on the 29th (+2.8). The lowest grass minimum on the 27th was 2.2C (+2.9). At Gorwel Heights, Llanfairfechan, the mean temperature was 13.8C (+1.3) [+1.2] of averages highest in May on record at the station. The mean maximum was 17.1C with the highest maximum 22.3C on the 16th and the lowest 11.8C on the 30th. The mean minimum was 10.4C with the highest 13.8C on the 16th and 17th and the lowest 7.5C on the 29th. Rainfall of 66.5 mm was largest since 2020 (91%) & [98%] of averages, the third consecutive month with below average rainfall. The 3-month (Spring) total was 131.8 mm, least since 2020 ranked 8th lowest in Llansadwrn records since 1928. The largest fall, not reaching double figures,l was 9.2 mm on the 9th. Rainfall at Gorwel Heights was 54.0 mm (71%) & [70%] of averages, again the third consecutive month below averages. The March to May (Spring) rainfall totalled 140.2 mm the least on record since 2011. Sunshine at RAF Valley totalled 187.3h with 3 sunless days. The sunniest day was on the 27th having 13.4h.
Spring 2022The spring mean temperature 10.3C highest since 2011 (10.4C) ranked 2nd highest in station records since 1979. Spring rainfall 131.8 mm was least since 2020 and ranked 8th lowest in Llansadwrn records since 1928.
June 2022A dry and sunny month with near average temperaturesRain at the beginning and end when warmest Rainfall of 47.2 mm (59%) & [64%] of averages was most since 2020, but ranked 27th lowest in Llansadwrn records since 1928. Rainfall since January totalled 374.7 mm lowest since 2013 and ranked 5th lowest. The wettest day had 10.4 mm this was on the 25th and there were 13 (+1.4) days with no precipitation. Dry days numbered 17 (+1.9); rain days 13 (-1.9); wet days 11 (-0.3) and days with 5 mm, or more, just 2 (-3.3). Rainfall at Gorwel Heights, Llanfairfechan, was 34.4 mm (43%) & [44%] of averages, least since 2018 (18.4 mm). here there were 17 dry days; 13 rain days; 10 wet days and only 1 reached more than 5 mm on the 26th when 11.0 mm fell. Rainfall duration (wet hours) was 53 h while in Llansadwrn it was nearly double at 92 h. The mean temperature 14.3C (-0.2) & [+0.2] of averages was lowest since 2019 and ranked 20 in station records since 1979. The mean maximum was 17.9C with the highest 24.8C on the 23rd in a spell of 3 days (21-33) with 20C, or more. The lowest maximum was 11.2C on the 5th. The mean minimum was 10.6C with the highest 14.8C on the 17th and lowest 6.6C on the 19th that also had the lowest grass minimum of 3.5C. At Gorwel Heights the mean temperature was 15.4C. The mean maximum was 19.0C with the highest maximum 26.0C on the 17th and the lowest 11.7C on the 5th. The mean minimum was 11.7C with the highest 15.9C on the 17th and the lowest 8.9C on the 1st. It was the 9th sunniest June on the Anglesey record since 1931.
July 2022Record maximum temperatures were recorded in Llanfairfechan... and in Britain several stations recorded in excess of 40C for the first timeBriefly hot on the 17th, 18th and 19th. Rainfall was below averages It was intensely hot on the 18th and 19th in Llanfairfechan with Gorwel Heights and Gorddinog recording maxima of 37.0C on the 19th. At Gorwel Heights the previous two days had 31.1C on the 17th and 35.3 C on the 18th. The highest temperature in Llansadwrn was 33.3C on the 19th, the second highest on record below the 34.9C recorded on 19th July 2006. Despite the 3 days of heat the mean temperature in Llansadwrn 17.1C was lowest since 2020 and ranked 8th in station records since 1979. The mean maximum 21.0C again lowest since 2020 ranked 10th and the mean minimum 13.1C ranked 8th. The highest minimum 21.2C on the 19th, also recorded at Gorwel Heights, was highest in station records for any month. The previous highest minimum in Llansadwrn was 19.6C on 2 August 1995 and at Gorwel Heights 20.5C on 24th July 2014. Rainfall in Llansadwrn was 32.3 mm (37%) & [42%] of averages, least since 2006 ranking 11th in Llansadwrn records since 1928. The wettest day was on the 1st with 10.2 mm. There were 15 days (+5.1) with no precipitation and 21 (+7.7) dry days. Rain days numbered 10 (-7.8); wet days 8 (-5.3) and there were 3 (-3.1) days with 5 mm, or more. A Gorwel Heights rainfall was 41.2 mm (46%) & [52%] of averages. Here the wettest day on the 1st had 14.2 mm. There were 19 dry days; 12 rain days; 8 wet days and 3 had 5 mm, or more. Rainfall duration (wet hours) was 64 h in Llansadwrn and 47 h at Gorwel Heights. Sunshine at RAF Valley totalled 198.8h sunniest since 2020 ranking 15th on the Anglesey record since 1931. The sunniest day was on the 16th with 12.9h and there were 2 sunless days.
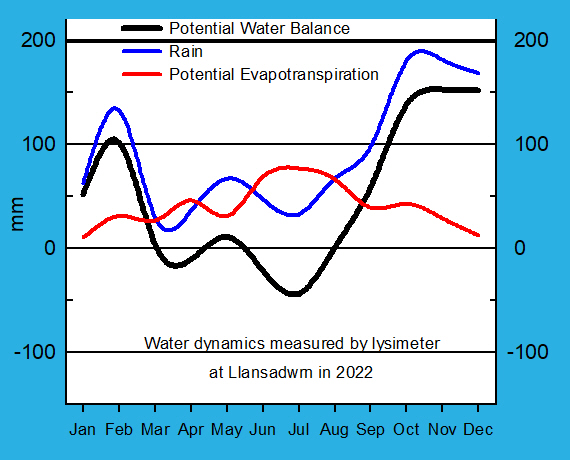
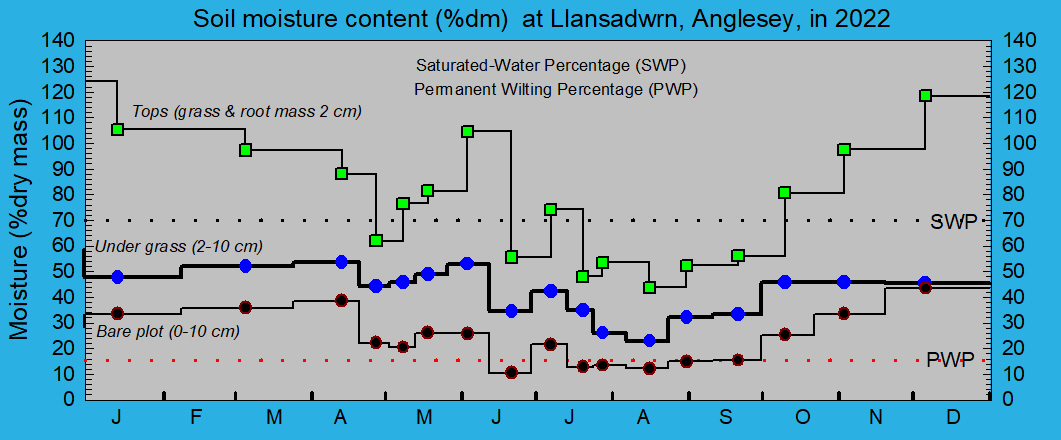
August 2022Warm, mostly dry and sunnyA wet day on the 1st just two sunless days with a hot day on the 14th The month began with a really wet day 37.0 mm, the wettest day of a dry year so far, and ended with a total of 67.4 mm (56%) & [75%] of averages, lowest in August since 2018, ranking 26 in Llansadwrn records. The annual total 474.4 mm so far is drier than the driest year on record 1945 that had 479.3 mm to the end of August. There were 15 days (+7.5) with no precipitation and 18 (+5.5) dry days (<0.2 mm). Rain days were 13 (-5.6); wet days 5 (-4.5) and just two had 5 mm, or more, bucking the trend of recent years (-3.0). Rainfall at Gorwel Heights, Llanfairfechan, totalled 73.6 mm (73%) & [84%] of averages, lowest on record at this station (12 years) previous least 74.8 mm in 2012. The wettest day was on the 1st having 35.8 mm (rank 4). There were 20 dry days; 11 rain days; 5 wet days; and 5 had 5 mm, or more. A warm month the mean maximum in Llansadwrn 17.5C (+1.8) & [+1.9] of averages highest since 1997 ranking 3 in station records since 1979. The mean maximum was impressively (+2.7) & [+2.6] of averages with one hot day on the 13th having 31.7C (+7.7) in a spell of 10 warm (>20C) days 6-15th, the lowest maximum 17.3C (+3.3) was on the 16th. The mean minimum 13.4C (+0.9) & [+1.1] was joint highest since 1997 ranking 3,, the lowest minimum 8.6C (+0.3) was on the 5th, he highest 18.2C (+2.3) on the 13th. The lowest grass minimum 6.0C (+1.4) was on the 5th. . Sunshine at RAF Valley was provisionally 243.4h with 1 sunless day. Sunniest were the 10th and 11th with 14.0h each. Summer 2022Driest since 2018 and ranking 10th driest in Llansadwrn records back to 1928. Temperatures were above the averages with the mean 16.3C highest since 2006 ranking 4th in station records since 1979. Sunshine at RAF Valley totalled 679.3h most since 2018 ranked 4th on the Anglesey record since 1931.
September 2022Temperatures continue above averages, dry except the last day, below average sunshineSome summery days and mostly dry A dry month except for the 30th when 30.0 mm of rain fell over 11 hours duration. Total for the month was 97.5 mm (97%) & [96%] of averages, least since 2020 rank 48 since 1928. There were 10 days (+1.0) without any precipitation; 13 dry days (+4.0; 17 (-0.8) rain days ); 13 (+0.3) wet days; and 7 (+0.8) had 5 mm, or more. Rainfall for the year so far had reached 571.9 mm ranking the 10th driest year since records began in 1928 in Llansadwrn, just 8.5 mm more than the driest year (Jan-Dec) 1945 with 563.4 mm. It has been the driest January to September since 1996 that had 473.5 mm. Rainfall at Gorwel Heights, Llanfairfechan, was 113.2 mm (115%) & [118% ] of averages, least since 2020. The wettest day was on the 4th with 19.2 mm, the 26th had 16.6 mm and the 30th 15.8 mm. There were 13 dry days; 17 rain days; 15 wet days; and 8 had 5 mm or more. Temperatures continued to be above averages with the mean 14.6C (+0.5) & [+0.6] lowest since 2020 ranking 7th highest in station records since 1979. The mean maximum was 18.0C with the highest 23.0C on the 2nd and lowest 16.5C on the 12th. The mean minimum was 11.1C with the lowest 7.0C on the 17th. The lowest grass minimum was 3.0C also on the 17th. At Gorwel Heights the mean temperature was 15.1C lowest since 2020. The mean maximum was 17.7C with the highest maximum 23.4C on the 5th and the lowest 12.3C on the 27th. The mean minimum was 12.5C with the lowest minimum 8.6C on the 28th. Sunshine at RAF Valley was a provisional 127.0h, the lowest monthly sunshine since February, The sunniest day was on the 16th with 10.7h, the only day to have double digits. There were 4 sunless days. October 2022Warmer and wetter with more sunshine and thunderstorms than normalWet at the beginning and end of the month drier in the latter part Temperatures were nearly 2 degrees above the 30-y climatological average, some days in the latter part of the month maxima were at least three or more. The mean 12.8C (+1.4) & [+1.7] of averages was equal highest (with 2005) since 2001 and ranked third highest in station records since 1979. The mean maximum 15.6C [(+1.6)] of averages was highest since 2004 and ranked fourth. The highest maximum on the 27th was 18.4C and the lowest on the 15th was 12.8C. The mean minimum 10.0C (+1.3) & [+1.8] of averages was highest since 2013 and ranked fourth. The 10th had the lowest minimum 5.0C and grass minimum 1.8C. At Gorwel Heights, Llanfairfechan, temperatures were highest since records began in 2011. The mean maximum was 16.5C with the highest maximum 20.2C on the 27th, but this was lowest since 2020 not exceeding the highest recorded 23.1C in 2017. The mean minimum was 11.2C, again highest recorded, with the highest 14.3C on the 23rd lowest since 2020. The highest temperature recorded at David Lee's station at Gorddinog on the 27th was 19.9C. Rainfall was 181.0 mm, lowest since 2019, ranked 14th largest in October in Llansadwrn records since 1928. October usually a wet month was largest since February and brought the total since January up to 752.9 mm above the driest year's 1945 total of 669.1 mm. Ten days had 5 mm rain, or more, the largest falls 28.8 mm on the 4th rain, 26.6 mm on the 7th and 22.2 mm on the 31st. Despite the wetness 2 days (-3.1) had and there were 8 (-1.9) dry days. Raindays were 23 (+1.8) and wet days 21 (+5.5). Rainfall duration (wet hours) was 130h with an average fall of 1.4 mm per hour. Rainfall at Gorwel Heights 160.2 mm was lowest since 2019. The wettest day was on the 4th having 30.0 mm. There were 9 dry days; 22 rain days; 20 wet days; and 10 had 5 mm, or more. Rainfall duration (wet hours) was 118h with an average fall of 1.4 mm per hour. Gorddinog had a total of 132.8 mm rainfall with the wettest day 27.6 mm on the 4th.
The month was sunnier than usual with the mean global solar radiation 6.36 MJ m -2. Seven days had 10 MJ m -2, or more, the highest 12.07 MJ m -2 on the 2nd and the lowest 1.70 MJ m -2 2 days later on the 4th
November 2022A wet month with above average temperatures and a record November high on the 13thTemperature well above average at the beginning returning to more normal by the end. Generally a wet month Records were smashed on the 13th when 21.2C was recorded at Porthmadog, 20.7C at Gorddinog, 20.1C in Llansadwrn and 19.2C at Gorwel Heights. In fact most places had temperatures well above the seasonal normal with warm air drawn up across the UK from Iberia and the Azores. The previous highest Llansadwrn temperature in November was 18.7C on the 5th in 2003, a huge 1.8 degrees less than the new record. The month's mean maximum was 12.2C (+1.6) & [+1.8] of averages, highest since 2011 ranking 3rd in station records since 1979. The lowest maximum was 9.0C (+2.4) on the 21st. The mean minimum was 7.1C [(+1.6)], highest since 2011 and ranking 3rd. The lowest minimum was 2.7C (+1.9) on the 19th and the lowest grass minimum was -1.8C (+1.6) also on the 19th. There were 7 days of ground frost (-1.1). The monthly mean temperature was 9.7C (+1.6) & [+1.7] of averages, highest since 2011 and ranking 3rd since 1979. At Gorwel Heights the mean temperature was 11.0C [(+2.2)] the highest 15.7C on the 11th when an overnight minimum of 14.4C was recorded. The mean maximum was 13.1C with the 19.2C on the 13th highest in records since 2011 and the lowest maximum 8.3C on the 21st. The mean minimum was 8.8C with the lowest 4.9C on the 22nd. Rainfall in Llansadwrn was 181.1 mm (133%) & [136%] of averages, just 0.1 mm larger that October. Most since 2017 ranking 14th largest in Llansadwrn records back to 1928. The wettest day with 37.4 mm was on the 7th was the most in the year so far bringing the annual total to 934.0 mm. There were 4 days with no precipitation and 8 dry days. There were 22 rain days (-1.0); 18 wet days (+0.6); and 13 (+4.7) days with 5 mm, or more. The number of wetter days continuing the current increasing trend. At Gorwel Height the total rainfall was 177.4 mm (146%) & [144%] of averages, most since 2015 that had 184.0 mm, the wettest month of the year so far bringing the annual total to 938.2 mm. The wettest day on the 21st had a record 54.0 mm of rain, highest daily fall in any month in station records back to 2011. There were 8 dry days; 22 rain days; 18 wet days; and 11 had 5 mm, or more. Driest since 2020, but 11th wettest in Llansadwrn records back to 1928. Temperatures were above the averages with the mean 12.3C highest since 2011 ranking 3rd in station records since 1979.
December 2022Temperatures were below average with often wintry weather, sunny at times with average decadal rainfall, but greater than the 1991-2020 averageA cold first half of the month especially 9-16th warmer and wetter in the second half Temperatures were lowest since the last really cold spell of 2010. The mean 5.1C (-1.9) & [-0.6] of averages ranked 12th lowest in station records since 1979. The mean maximum 7.7C (-1.6) & [-0.1] of averages the highest maximum 13.6C on the 19th and the lowest 0.7C (-4.5) on the 13th. Several places in Britain had 'ice days'. The mean minimum 2.4C (-2.2) & [-1.1] with the highest 8.0C on the 25th and the lowest -3.9C on the 13th. There were 8 air frosts (+6.6) on the 9-16th and frost duration was 88.8h. There were 19 (+6.5) ground frosts with the lowest -9.1C on the 13th several mornings had hoar frost and rime. On the 14th the ground was frozen hard to a depth of 5 cm. At Gorwel Heights in Llanfairfechan the mean temperature was 6.1C (-1.7) & [-0.3] of averages was highest since 2018. The mean maximum was 8.3C with the highest 15.4C on the 18th and 19th, lowest since 2020, the lowest was 1.0C on the 13th. The mean minimum was 3.9C lowest since before 2011 with the highest 8.8C on the 25th and the lowest -1.9C on the 14th. There were 4 air frosts on the 12-15th and frost duration was 33.5h. Rainfall in Llansadwrn was 168.4 mm (99%) & [124%] of averages largest since 2020 ranking 17th in records back to 1928. The wettest day on the 27th had 44.0 mm that was also the wettest day of the year. There was no precipitation recorded on 4 (+1.3) days and there were 8 (+1.4) dry days. Rain days were 23 (-1.7); wet days 19 (-1.1) and 9 (-2.1) had 5 mm, or more. Rainfall duration (wet hours) totalled 153h. At Gorwel Heights rainfall was a little more with 172.4 mm (95%) & [101%] of averages lowest since 2019. There were 9 dry days; 22 rain days; 18 wet days; and 11 had 5 mm, or more. Rainfall duration was 153h the same as Llansadwrn. In Llansadwrn sleet or snow fell on 3 days while small hail fell on 14 days (+6.0). Sunshine at RAF Valley totalled a provisional 49.4h highest since 2010 (61.6h). The sunniest days was on the 12th with 6.2h and there were 8 sunless days.
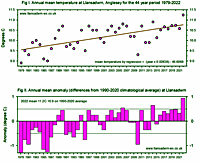
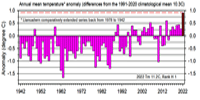
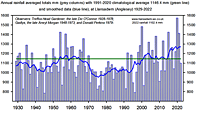
Annual 2022It was the warmest year on record in Britain the mean exceeding 10C for the first time. In Llansadwrn the mean 11.2C was also the highest recorded at the station over 44-years
| |||||||||||||||||||||||||||||||||||||||||||||||||||||||||||||||||||||||||||||||||||||||||||||||||||||||||||||||||||||||||||||||||||||||||||||||||||||||||||||||||||||||||||||||||||||||||||||||||||||||||||||||||||||||||||||||||||||||||||||||||||||||||||||||||||||||||||||||||||||||||||||||||||||||||||||||||||||||||||||||||||||||||||||||||||||||||||||||||||||||||||||||||||||||||||||||||||||||||||||||||||||||||||||||||||||||||||||||||||||||||||||||||||||||||||||||||||||||||||||||||||||||||||||||||||||||||||||||||||||||||||||||||||||||||||||||||||||||||||||||||||||||||||||||||||||||||||||||||||||||||||||||||||||||||||||||||||||||||||||||||||||||||||||||||||||||||||||||||||||||||||||||||||||||||||||||||||||||||||||||||||||||||||||||||||||||||||||||||||||||||||||||||||||||||||||||||||||||||||||||||||||||||||||||||||||||||||||||||||||||||||||||||||||||||||||||||||||||||||||||||||||||||||||||||||||||||||||||||||||||||||||||||||||||||||||||||||||||||||||||||||||||||||||||||||||||||||||||||||||||


