|
Above average rainfall and below average temperatures A wet month carrying on from the record breaking wet 2020. The 180.6 mm of rainfall this month (169%) & [175%] of the new averages, even wetter than last, largest since 2008, ranking 7th in Llansadwrn records since 1928. The largest fall was on the 18th having 31.5 mm. There were 9 falls (+1.4) of 5 mm, or more; and 15 (-2.0) wet days. Rain days were 24 (+1.3); day days 7 (-1.3); and just one, he 31st, had no precipitation (-2.8) of average. Rainfall duration totalled 169 wet hours. Rainfall at Gorwel Heights totalled 205 .0 mm (223%) & [230%] of averages, wettest on record since 2011. The wettest day was on the 20th with 34.2 mm, 29.4 mm fell on the 18h and 28.6 mm on the 19th, the three days totalling 92.2 mm 45% of the monthly total. Days with 5 mm, or more, were 11; wet days were 17; rain days 22; and dry days 9. Rainfall duration totalled 173 wet hours. It was the coldest January since 2010. The mean temperature 4.1C (-1.4) & [-1.3] of the new averages, lowest since 2010 and ranking 6th in station records since 1979. The mean maximum 6.4C (-1.6) & [-1.5] ranked 5th in station records. The highest maximum 10.0C on the 19th (-1.9) equal lowest (2011) since 2010, the lowest 2.7C (-0.9) on the 8th lowest since 2013. The mean minimum 1.8C (-1.3) & [-1.1] equal lowest (2011) since 2010 ranked 12th. The lowest minimum was -2.2C on the 9th and lowest since 2014 (-2.8). There were 8 air frosts, most since 2013 (10), with 46.5h of frost. There were 21 ground frosts (+3.9) most since 2015 (25) with the lowest -9.2C (-2.9) on the 7th lowest since 2009 (-9.7C). The mean temperature at Gorwel Heights was 4.8C January lowest station record (-1.5) & [-1.4]. The mean maximum 6.6C was a January low station record with the highest 12.2C on the 28th second lowest on record 2019 (11.4C) The lowest maximum 2.3C on the 8th was fourth lowest (0.5C in 2013). The mean minimum 2.9C was lowest on record, the lowest -0.8C on the 9th was third lowest. There were 3 days of air frost but only 7.2h fell below freezing. The wintry month in Llansadwrn had 12 days (+5.5) of small hail, most since 2015. Sleet or snow fell on 6 days equal 2019, most since 2013. There were no days (-0.6) with snow lying at 0900 GMT, least since 2019 (2), there were 10 in 2010.
February 2021Above average temperatures, rainfall and sunshineA month of contrasts the beginning cold and wintry the end milder, wet and windy The mean temperature in the first half of the month 4.2C was below average (-1.7) & [-1.4], but by the end with a spell of very mild weather ended on 6.1C (+0.2) & [+0.5] of averages, lowest since 2018, but ranked 16th highest in station records. The mean maximum was 8.6C with the highest maximum 12.5C on the 20th and the lowest 1.7C on the 9th -2.6C based on the decadal average. The mean minimum was 3.6C with the highest 9.1C on the 20th and the lowest -2.1C on the 11th. There were 6 days of air frost of 53.3h duration. There were 12 days with a ground frost (-3.0), the lowest -7.3C on the 11th (-1.3) of average. At Gorwel Heights the mean temperature was 6.8C [(+0.6)] of averages, equal highest with 2014 since 2011. The mean maximum was 9.3C highest since 2019 (12.0C), the highest maximum was 14.3C on the 23rd second only to Rhyl's 15.0C, it was only 11.2C in Llansadwrn. The mean minimum was 4.2C lowest since 2018, the lowest minimum -2.3C on the 13th, frost duration was 71.5h, there were six air frosts in a spell from the 9-14th. It was a wet month in Llansadwrn where rainfall totalled 146.6 mm (143%) & [182%] of averages, lowest since 2019, ranking the 8th wettest February in Llansadwrn records since 1928 The wettest day was on the 23rd when 50.6 mm fell over 23h duration, the second highest February daily total in station records since 1979 only beaten by the 55.3 mm recorded in 2020 when the months total reached a record 250.6 mm. There were 3 days (-2.0) with no precipitation, 11 (+2.4) dry days; 17 (-2.7) rain days; 15 (+1.8) wet days; and 9 (+2.8) had 5 mm, or more. It was drier at Gorwel Heights, the total rainfall 95.8 mm, lowest since 2019, (113%) & [128%] of averages. The wettest day was on the 23rd with 18.4 mm over 21h duration. Rainfall duration during the month was 104h. Dry days were 13; rain days 15; wet days 12; and 8 days had 5 mm, or more. A very windy month at Gorwel Heights with a mean wind speed of 8.8 mph, the highest 25.4 mph on the 12th and 23.3 mph on the 23rd. On 10 days high gusts of more that 40 mph were recorded, highest recorded were 57 mph on the 18th; 58 mph on the 19th; 63 mph on the 20th and 64 mph when significant structural damage occurred in the village of Llanfairfechan. In Llansadwrn snow fell on 2 days and small hail on 7 days. Sunshine at RAF Valley totalled 92.8h, sunniest since 2019 ranking the 20th sunniest February on the Anglesey record back to 1931. The sunniest day was on the 28th with 10.1h duration, there were 7 sunless days. Winter 2020/21Second wettest winter on record in Llansadwrn. Temperatures below the station averages.
March 2021Temperatures and rainfall above average, a little duller than averageWet and wintry at times, above average temperatures at the end of the month Another wet month with 124.7 mm bringing the total so far this year to 451.9 mm, but 64.7 mm below last year's total. Wettest in March since 2019 and (151%) & [159%] of averages. The wettest day was on the 14th with 30.0 mm while 23.8 mm fell the next day resulting in standing water on garden and fields. Despite this there were 8 days (+0.6) with no precipitation and 13 dry days (+0.1). Rain days were 18 (-0.1); wet days 11 (-3.5); and 6 days (-2.4) had 5 mm, or more. It was drier in Llanfairfechan at Gorwel heights with 90.0 mm (103%) & [109%] of averages. The wettest day was on the 9th having 13.4 mm with 12.6 mm falling on the next day. The 27th had 12.0 mm and the 28th 11.2 mm. There were 15 dry days; 16 rain days; 13 wet days; and 8 had 5 mm, or more. Rainfall duration (wet hours) was 92h at Gorwel Heights and 99h in Llansadwrn. It was wintry at times with sleet falling on the 11th and 26th. Hail fell on 3 days (-2.3) of average. A windy month with gales in the area on 5 days. Temperatures were a little above normal with the mean 7.4C (+0.5) & [+0.4] of averages, highest since 2019 ranking 15th since 1979. The mean maximum was 10.3C with the highest maxima 18.6C on the 30th and 16.8C on the 31st the only two >15C. There were 15 days <10C the lowest maximum 5.6C on the 4th. The mean minimum was 4.4C (+0.8) & [+0.7] of averages. There were 2 air frosts this month the lowest -1.0C on the 6th the other -0.6C the previous day. There were 7 ground frosts, significantly (-8.0) of average, the lowest -6.4C on the 6th was (-1.7). A little warmer in Llanfairfechan at Gorwel Heights with the mean 7.9C [(+0.4)] highest since 2014. The highest maxima were 17.7C on the 30th highest since 2014 and 16.1C on the 31st. The mean minimum was 5.3C equal highest (2019) since 2017. There were no air frosts the lowest 0.8C on the 7th. Sunshine at RAF Valley totalled 114.4h (88%) & [95%] of averages. The sunniest day was on the 1st of the month with 10.3h and there were 7 sunless days.
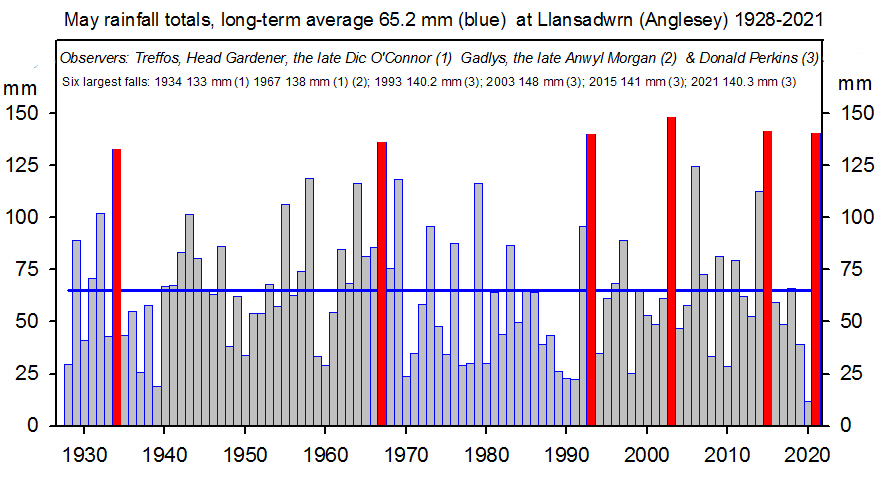
April 2021Sunniest on record. Very dry, but temperatures lower than averagesWintry at the beginning, very dry in the latter half A very dry month with 16.7 mm of rainfall (31%) & [25%] of averages, the 6th lowest on record in Llansadwrn since records began in 1928. The lowest 6.7 mm in 1980 and 11.7 in 1984 mm are held by this station; 11.9 mm was recorded at Treffos in 1938, 13.2 mm in 1957 and 15.0 mm in 1974. There was no precipitation on 16 days (+4.4) and there were 19 dry days (+4.8). Rain days were 11 (-4.8); wet days 7 (-4.3). The wettest day with 3.6 mm fell on the 30th. At Gorwel Heights 16.6 mm fell in the month (22%) & [26%] of averages, the driest on record since 2011. There were 19 dry days; 11 rain days; 8 wet days; and none exceeded 5 mm. The wettest day on the 11th had 4.8 mm. Rainfall duration was only 25 h and at Llansadwrn 34 h. The month had lower than average temperatures with frequent cool air from Arctic regions. Sleet or snow fell on 5 days (+4.3), the most since 1998, and small hail on 5 days (+2.2). I have not recorded any lying snow in April. The mean temperature 7.7C (-1.6) & [-1.4] of averages was lowest since 2013 ranking 8th in station records since 1979. The mean minimum 3.4C (-2.2) & [-2.0] of averages ranked 3rd lowest in records. The lowest minimum was -0.1C on the 11th, equal lowest with 2015 since 2013 that had -1.1C. There were 16 ground frosts (+9.0) the hardest -4.3C on the 11th, a record number at this station in April, previous highest 14 in 2013. The warmest day was on the 23rd having 19.8C in the afternoon with a low RH of 24% at 1632 GMT. At Gorwel Heights the mean temperature was 7.8C (-2.1) & [-1.8] of averages, second lowest on record at this station (2012 had 7.7C). The mean maximum was 11.0C with the highest maximum 18.6C on the 23rd. The mean minimum was 4.6C, lowest 0.7C on the 11th so no air frost here. It was a record sunny April at RAF Valley by a mile. The provisional 251 h of sunshine (one missing record on 28th estimated as 3.1h) most on the Anglesey record since 1931. The previous sunniest April was in 2015 having 232.7 h. The sunniest day was on the 22nd with 13.1h and there were no sunless days. May 2021Wet with temperatures below averagesWintry at the beginning with a hint of summer at the end Another wet month bringing the total rainfall accumulated in the year so far 608.9 mm, half the annual averages, to the most in Llansadwrn since records began in 1928 exceeding last year's record amount. Rainfall in May was 140.3 mm (208%) & [207%] of averages, ranking 3rd wettest on record only exceeded by 2015 141.3 mm and 2003 148.3 mm. The six wettest Mays in Treffos and Gadlys in Llansadwrn, with only a few millimetres between them, are shown in the graphic. Four of these large falls occurred in the last 40 years and two in the previous 60 years, more frequent falls are an indication of the climate changing The wettest day was on the 20th having 35.2 mm, six days (+1.4) exceeded 5 mm and 19 were wet days (+8.8) with 1 mm, or more. There were however five days (-7.2) with no precipitation; 7 (-9.0) were dry <0.2 mm; and there were 24 (+9) rain days, those defined as having 0.2 mm, or more. Rainfall duration was 129 wet hours. It was wet too in Llanfairfechan, at Gorwel Heights rainfall was 154.8 mm (2025) & [201%] of averages. The wettest day was on the 20th when 40.2 mm fell. There were 8 dry days; 23 rain days; 17 wet days; and 7 days had 5 mm, or more. Rainfall duration was 134 wet hours. May followed on from April with lower than average temperatures making it a colder spring than in recent years. The mean temperature 10.6C [(-1.2)] was lowest since 2015 ranked 6 in station records since 1979. The mean maximum 14.4C (-1.1) & [-1.2] again lowest since 2015 ranked 7. The highest maximum had to wait until the 30th for 21.9C (-0.3) while the lowest was 10.9C (+0.3) on the 3rd. The mean minimum 6.7C [(-1.2)] ranked 6, the lowest 0.7C (-2.7) was on the 6th. There were 5 ground frosts (+3.6) with the lowest -2.7C (-1.7) on the 7th. The mean temperature at Gorwel Heights 10.8C (-0.9) & [-1.7] of averages with 2013 and 2015 lowest in station records since 2011. The mean maximum 14.1C was lowest since 2015 rank 2 with the highest maximum 23.1C on the 30th. The mean minimum 7.5C was lowest in station records in May, the lowest minimum 2.2C was on the 6th again lowest in station records since 2011. Spring 2021With 281.7 mm rainfall it was the seventh wettest winter on record in Llansadwrn, last year with 122.7 mm was the fourth driest on record. The wettest spring was in 1947 having 352.0 mm the driest 1990 with 80.2 mm. Temperatures were below the station averages with the mean lowest since 2015.
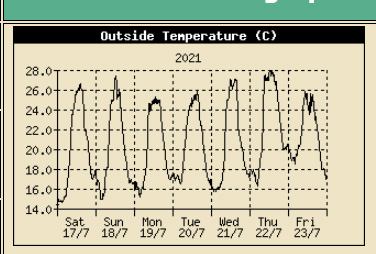
June 2021Drier and warmer than average and fairly sunnySome nice summer days with awful ones in between Rainfall was less than normal the 44.9 mm (54%) & [61%] of averages least since 2018 and ranked 25th lowest in Llansadwrn records since 1918. Despite the lower than average figures the total for the year so far 653.8 mm is the largest recorded in Llansadwrn to this date. The most rain 17.5 mm fell on the 25th, a really awful day that was also the dullest, with rainfall duration 11 h. There were, however, 16 days (+5.2) with no precipitation and 21 (+6.5) were recorded as dry (<0.2 mm). Rain days were 9 (-6.5); wet days 6 (-5.9); and 4 (-1.2) had 5 mm, or more. Rainfall duration (wet hours) was 57h. Rainfall at Gorwel Heights was 44.2 mm (56%) & [62%] of averages. Here the wettest day was also on the 25th with 22.4 mm. Dry days were 24; rain days 6; wet days 6; and 3 had 5 mm, or more. Rainfall duration (wet hours) was 51h. The mean temperature in Llansadwrn was 14.7C (+0.5) & [+0.7] equal highest since 2018 ranking 13th in station records since 1979. The mean maximum was 18.5C ranking 11th, highest since 2019, the highest 24.2C was on the 1st and the lowest 13.2C on the truly awful day of the 25th. The mean minimum was 11.0C lowest since 2015 ranking 9th highest while the highest 13.7C was on the 2nd and the lowest 7.9C on the 23rd, this lowest since 2015. The lowest grass minimum 4.0C (+0.9) was on the 5th. A Gorwel Heights the mean temperature was 15.9C (+1.1) & [+1.0] of averages with the highest 20.1C was on the 2nd and lowest 11.7C on the awful 25th. The mean maximum was 19.6C with the highest 25.3C on the 13th. Twelve days had >20C with 24.3C on the 1st and 24.4C on the 2nd. The mean minimum was 12.2C with the highest 15.8C on the 2nd and the lowest 9.5C on the 4th. Sunshine at RAF Valley was 201.3h most since 2019 and ranking 29th on the Anglesey record since 1931. The sunniest day was on the 4th with 15.7h and there were 6 sunless days. July 2021Warmer, drier and sunnier than averageThe first half was drier than usual, but dull with average temperatures. The second half continued dry and with plenty of sunshine turned hot It was the driest July since 2018 and ranked 38th in Llansadwrn since 1928. The 66.2 mm was (76%) & [85%] of averages. There were 15 days (+4.9) with no precipitation and 18 (+4.9) dry days. There were 13 (-4.9) rain days; 10 (-3.4) wet days; and 6 (-0.3) had 5 mm, or more. For the first month in 19 rainfall accumulated since the beginning of last year fell below the previous record total. The total accumulated so far this year is 720.0 mm. The wettest day was on the 27th having 18.9 mm and rainfall duration (wet hours) was 66h. It was wetter in Llanfairfechan, at Gorwel Heights the 78.0 mm (87%) & [98%] of averages, lowest since 2018. The wettest day was on the 27th with 15.6 mm. Rainfall duration (wet hours) was 69h. In Llansadwrn there was a record 7 consecutive days (17-23) with a maximum temperature that reached 25C, or more. At Gorwel Heights the mean temperature was 17.3C (+0.8) & [0.6] of averages, highest since 2014. The mean maximum was 20.5C, highest since 2018, with the highest 27.4C on the 23rd. There were only 3 hot days (>=25C) on the 20th, 22nd and 23rd. The mean minimum was 14.1C, highest since 2017. The highest 18.1C was on the 23rd, highest since 2019. The lowest minimum 11.4C on the 6th was highest since 2018.
August 2021Dry with temperatures close to averagesMost rain at the beginning with a very dull spell in the middle ending warm and sunny A drier month than average the 69.0 mm (66%) & [77%] of averages, least since 2018 and much less than last August's 168.5 mm. The wettest day was on the 7th having 21.6 mm the third day of a wet spell 5-7th that had 40.4 mm 59% of the month's total. The 20th another wet day had 12.0 mm. Days with no precipitation total 8 (+0.8) and dry days 18 (+6.4). Rain days were 13 (-0.4); wet days 9 (-4.9); and days with 5 mm, or more, were 4 (-1.1). Rainfall at Gorwel Heights in Llanfairfechan was 62.8 mm (62%) & 71%] of averages, least on the 10-y station record. The wettest day was 7th with 23.4 mm. There were 21 dry days; 10 rain days; 10 wet days; and 5 had 5 mm, or more. Rainfall duration (wet hours) was 67h and in Llansadwrn 85h. Temperatures were close to averages, there were no hot >25C days with 8 warm days reaching 20C, or more, with 5 of them in a spell 22-26th. The mean maximum was 18.6C (+0.3) & [-0.3] of averages with the highest a modest 21.9C on the 25th (-1.5). The mean minimum was 12.5C (+0.1) & [+0.2) with the highest 14.7C on the 6th and lowest 10.3C on the 2nd (+2.2). The mean temperature 15.6C was lowest since 2017. Gorwel Heights had 8 warm days (>20C) with a mean maximum of 19.0C the highest 22.9C on the 11th and lowest 15.8C on the 17th. The mean minimum was 13.3C with the highest 14.9C on the 21st and the lowest 11.1C on the 2nd. The mean temperature 16.2C lowest since 2018 was on the 10-y average and [-0.6] on the 30-y average. Summer 2021Driest since 2018 and ranking 27th driest in Llansadwrn records back to 1928. Temperatures were above the averages with the mean 15.9C highest since 2018 ranking 19th in station records since 1979.
September 2021Record high temperatures, duller with above average rainfallDry with two hot days and a thunder storm at the beginning turning wetter with cooler autumnal thundery weather at the end Two hot days with maxima of 25.2C on the 7th and 28.2C on the 8th highest of the month and year, just pipping the 28.1C on 22nd July with 28.3C at Gorwel Heights on the 8th the highest in September since before 2011. The 28.2C in Llansadwrn was the highest in September on record beating the 28.0C on 4th 2005. The mean maximum in Llansadwrn was 19.1C highest since 2014 and third highest since before 1979. The mean minimum temperature 12.7C and the highest minimum 18.0C on the 8th were also September record highs at this station. At Gorwel Heights the mean minimum 13.5C and highest minimum 18.2C on the 8th were highest on record since before 2011. September one of the wetter months of the year exceeding 100 mm the 44th in records back to 1928. It began on the dry side, but with a fall of 15.8 mm on the 5th and a wet end with 31.2 mm on the 26th, largest of the month, the 113.7 mm accumulated (109%)& [112%] of averages, ranked 38th and was largest since 2019. Rainfall at Gorwel Heights 124.0 mm (126%) &[129%] of averages was also wettest since 2019 with the largest fall 38.0 mm on the 26th. Rainfall duration (wet hours) was 76h at Gorwel and 97h in Llansadwrn with the rain per hour 1.6 mm and 1.2 mm respectively. Dry days were 12 and 13; rain days 18 and 17; wet days 10 each; and days with 5 mm, or more, 10 each station. Sunshine at RAF Valley was 117.5h lowest since 2017. The sunniest day was on the 7th with 12.0h and there were 4 sunless days. October 2021Warmer, wetter and sunnier month than than usualSeveral wet days through the month with a very wet and windy end A very wet month the 249.1 mm rainfall (196%) & [193%] of averages largest since 2008 ranking third in Llansadwrn records since 1928. In the last five days 108.6 mm fell 44% of the month's total. The wettest day was on the 27th when 43.5 mm fell followed by 35.6 mm on the 28th resulting in some local flash flooding. There were 14 days (+6.1) with 5 mm, or more. Wet days numbered 24 (+8.9); rain days 27 (+6.2); and there were 4 (-6.2) dry days. At Gorwel Heights in Llanfairfechan 230.8 mm fell (186%) & [183%] of averages second wettest October since records began in 2011, here the wettest day was was on the 29th with 38.4 mm. Twelve days had 5 mm, or more; there were 19 days wet days; 22 rain days; and 9 dry days. Rainfall duration (wet hours) was 170h at Gorwel Heights and 194h in Llansadwrn. Temperatures were above the averages. The mean temperature in Llansadwrn 12.0C (+0.8) & [+0.9] of averages was highest since 2017 and ranked 10th in station records since 1979, the highest mean was 16.2C on the 8th and the lowest 8.4C on the 21st. The mean maximum was 14.3C (+0.5) & [+0.3] of averages highest since 2017 ranked 20th in station records the highest a modest 18.4C(-0.9) was on the 8th. The mean minimum was 9.7C (+1.0) & [+1.5] highest since 2013 and ranked 6th. The lowest minima were in the air 5.4C (+1.3) rank 6th on the 21st and on the grass 1.8C (+2.2) on he 16th. At Gorwel Heights the mean temperature was 13.2C (+0.7) & [+1.3] of averages, highest since 2014. The mean maximum was 15.6C, highest since 2018, with the highest maximum 21.1C on the 21st, highest since 2018. The lowest maximum was 11.2C on the 21st highest since 2017. The mean minimum was 10.9C, highest since 2013, with the lowest 7.6C on the on the 21st highest since 2014.
November 2021Driest and since 2014, not was warm as 2019, but the mean temperature ninth highest since 1979Very dull mid-month, wet at the beginning and wintry and very stormy and wet again at the end Although not as warm as 2019 the mean temperature 8.7C (+0.4) & [+0.8] ranked ninth in station records since 1979. The mean maximum 10.9C (0.0) & [+0.5] highest since 2019 ranked 13th in station records. Maxima were lower than usual with the highest 13.4C on the 8th and 9th (-1.8), the lowest 5.5C on the 27th during Storm Arwen was (-1.6) of the average over the last 10-y. Minima were above average with the mean 6.5C (+0.8) & [+1.0] of averages, highest since 2016 ranking 6th. The lowest minimum on the 29th was 0.4C (-0.7) and although there were no air frosts there were 5 ground frosts (-2.9) with the lowest -4.1C also on the 29th. In Llanfairfechan at Gorwel Heights the mean temperature was 9.6C (-0.3) & [+0.8] of averages was lowest since 2013. The mean maximum was 11.4C with the highest 16.3C on the 8th and the lowest 5.6C on the 27th. The mean minimum was 7.7C with the highest 13.4C on the 29th and lowest 2.0C on the 29th. With total rainfall of 100.2 mm (76%) & [75%] of averages, ranking 30th lowest in Llansadwrn records since 1928, it was driest since 2014. The wettest day was on the 30th with 27.2 mm. There were 3 days with no precipitation; 7 dry days; 23 rain days; 14 (-2.8) wet days; and 6 days (-2.1) with 5 mm, or more. Rainfall at Gorwel Heights was 83.8 mm (69%) & [68%] of averages, lowest since 2014. There were 15 dry days; 15 rain days; 14 wet days; and 6 days had 5 mm, or more. Rainfall duration at Gorwel heights was 106h while in Llansadwrn it was 129h. Sunshine at RAF Valley was 50.0h ranking 31 on Anglesey records back to 1931, but sunniest since 2018. The sunniest day was on the 22nd having 6.4h while there were 9 sunless days. Driest since 2017, but 10th wettest in Llansadwrn records back to 1928. Temperatures were above the averages with the mean 12.2C highest since 2011 ranking 3rd in station records since 1979.
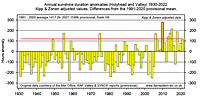
December 2021Warmest since 2018 and above the 30-y average, driest since 2019, but ranked 18th wettest since 1928. Record highest maximum temperatures in Llanfairfechan on the 31stBegan wintry with hail on four days then turned very mild and wet at the end The mean temperature 6.9 C (+0.1) & [+1.3] of averages was highest since 2018 ranking 7th in station records since 1979. The mean maximum 9.3C (+0.1) & [+1.5] of averages ranked 5th with the highest maximum 15.6C (+2.6) on the 31st highest since 2015 when 16.1C was recorded on the 27th the highest in December at this station. The 15.6C was recorded at 0350 GMT on 1 January 2022 that by convention is assigned to the 24h ending 0900 GMT (the 31st). One of the highest maxima on this date, but see Llanfairfechan below, equalling the long-standing record of 15.6C recorded at Great Yarmouth (Norfolk) in 1901 (TORRO). The lowest maximum 5.2C was on the 20th and 21st. The mean minimum was 4.6C (+0.1) & [+1.1] of averages again highest since 2018 ranked 7th in station records. There were 2 air frosts -0.1C on the 20th and -0.8C on the 22nd. There were 13 ground frosts, the lowest -4.4C was recorded on the 22nd. At Gorwel Heights in Llanfairfechan the mean temperature 8.1C was (-0.4) & [+1.7] of averages lowest since 2014. The mean maximum was 10.5C highest since 2016. The highest maximum 19.3C occurred at 0240 GMT on the 1 January 2022 during a 52 mph S'ly Föhn wind off the mountains with a relative humidity of 41%, a station record for December and one of the highest temperatures recorded in Britain on this date. At 2040 GMT on the 31st December 17.0C was recorded, highest since 2015, this would also have been the highest maximum, but for the 19.3C. At Gorddinog AWS operated by David Lee to the west 18.2C was recorded at 0350 GMT in a 48 mph wind while at Dwygyfylchi to the east 18.3C was reported. The mean minimum was 5.7C, highest since 2018. The lowest was 0.8C on the 22nd there being no air frosts recorded. Rainfall in Llansadwrn was 163.2 mm, lowest since 2019, but ranking 18th highest in Llansadwrn records since 1928. The wettest day was on the 30th when 44.5 mm fell. The was just 1 day (-1.7) with no precipitation and 8 (+2.3) dry days. Rain days were 23 (-2.3); wet days 19 (-1.6); and 11 days (-0.2) had 5 mm, or more. At Gorwel Heights in Llanfairfechan rainfall was 190.6 mm, lowest since 2019. The wettest day with 48.2 mm was on the 7th. There were 9 dry days; 22 rain days; 17 wet days; and 13 days had 5 mm, or more. Rainfall duration (wet hours) totalled 162h in Llansadwrn and 140h at Gorwel Heights. Sunshine at RAF Valley was 38.4h with 6.1h on the 18th, there were 13 sunless days.
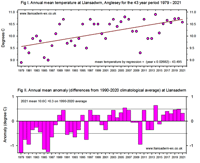
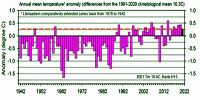
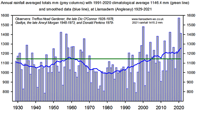
Annual 2021Tempertures lowest since 2018, but 6th highest since 1979 with the local and global warming trend continuing. Rainfall lowest since 2019, but 5th largest since 1928, with the trend to recent wetter years continuing.
Monthly data 2021
Llanfairfechan, Gorwel Heights observations
AcknowledgementsThe Met Office at RAF Valley kindly supplied observational data from 1942 to 2011. Current data (provisional) are gathered from SYNOP reports and METAR, any missing observations are initially derived from nearby stations to complete the record, up to date figures are later gathered from the Met Office website. I am grateful Ivor McLean former Met Officer at RAF Valley for early Holyhead sunshine and various other observations; David Lee for use of his observations from Gorddinog; and Gordon Perkins (BlueTractorSoftware) for observations at Gorwel Heights and providing additional observations.
| |||||||||||||||||||||||||||||||||||||||||||||||||||||||||||||||||||||||||||||||||||||||||||||||||||||||||||||||||||||||||||||||||||||||||||||||||||||||||||||||||||||||||||||||||||||||||||||||||||||||||||||||||||||||||||||||||||||||||||||||||||||||||||||||||||||||||||||||||||||||||||||||||||||||||||||||||||||||||||||||||||||||||||||||||||||||||||||||||||||||||||||||||||||||||||||||||||||||||||||||||||||||||||||||||||||||||||||||||||||||||||||||||||||||||||||||||||||||||||||||||||||||||||||||||||||||||||||||||||||||||||||||||||||||||||||||||||||||||||||||||||||||||||||||||||||||||||||||||||||||||||||||||||||||||||||||||||||||||||||||||||||||||||||||||||||||||||||||||||||||||||||||||||||||||||||||||||||||||||||||||||||||||||||||||||||||||||||||||||||||||||||||||||||||||||||||||||||||||||||||||||||||||||||||||||||||||||||||||||||||||||||||||||||||||||||||||||||||||||||||||||||||||||||||||||||||||||||||||||||||||||||||||||||||||||||||||||||||||||||||||||||||||||||||||||||||||||||||||||||||


