|
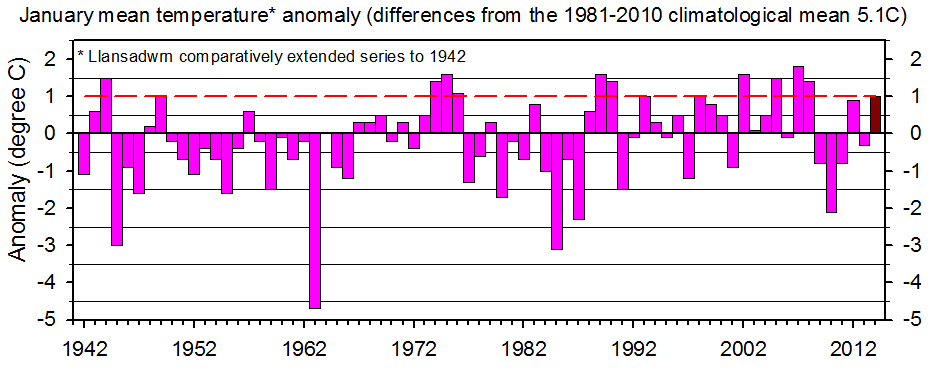
January 2014Wet, stormy, mild and dullThe mix of weather spread throughout the month
Rainfall was 146.2 mm (140%) & [143%] of averages, most since 2008 ranking 15th largest back to 1929. The wettest day was on the 8th with 17.2 mm. Other falls over 10 mm were on the 5th [12.4 mm]; 14th [13.0 mm] and the 26th [15.1 mm]. Days with 5 mm, or more, numbered 13 (+5.6) and there were 24 (+8.1) wet days with 1.0 mm, or more. Rain days with 0.2 mm, or more, numbered 26 (+5.7). Dry days with <0.2 mm were few and far far between 5 (-5.7) and those with no precipitation just 3 (-3.4).
In Llansadwrn there were 8 sunless days with mean solar radiation 2.52 MJ m -2. Highest was 5.51 MJ m -2 on the 30th and lowest 1.22 MJ m -2 on the 6th. Sleet was observed on the 4th and 13th. Ice precipitation occurred on 8 days (+2.4) including 2 days of large hail: 9 mm on the 3rd and 5 mm ice pellets on the 25th during the sudden onset of heavy thunder and lightning between 1220 and 1232 GMT on arrival of a cold front when the temperature dropped 5.3C: precipitation fell at rates up to 94 mm/h at 1221 GMT in Llansadwrn; 76 mm/h at Gorwel Heights at 1228 GMT and at up to 105 mm/h at Gorddinog, Llanfairfechan. Thunder was also heard on the 6th accompanied by small ice pellets.
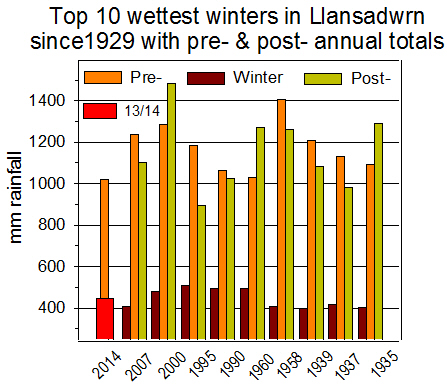
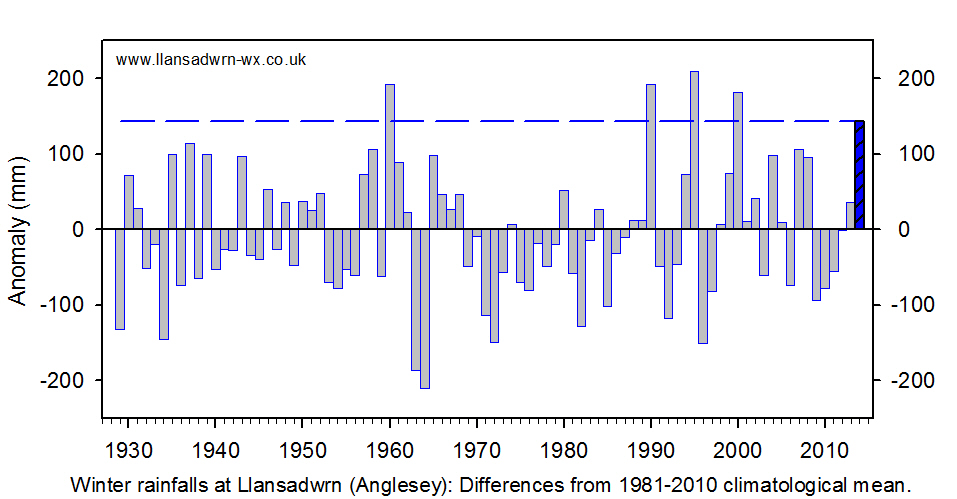
February 2014Very stormy, generally dull, mild and wetSuccession of depressions with storms and high winds through the month except 2 spring-like days at the end The strong winds, mostly SW'ly (11 days), was the most significant feature of the month's weather. At Gorwel Heights in Llanfairfechan gusts of 50 mph, or more, were recorded on 11 days. The highest were 58 mph on the 14th and 57 mph on the 12th. Similarly at Gorddinog gusts of 50 mph, or more, occurred on 7 days, the highest 66 mph on the 14th and 59 mph on the 4th and 12th. A gust of 64 mph was recorded in Llansadwrn on the 12th. At RAF Valley (provisional data) 9 days of gales were reported, most =2002 since 1997, with gusts of 50 mph, or more, on 6 days. On the 12th gale-force winds were reported hourly for 14h with a highest gust of 80 mph. Temperatures were above average. In Llansadwrn the mean was 6.3C (+0.8) & [+1.0] of averages, highest since 2011 ranking 10th since 1979. The mean maximum was 8.8C (+0.6) & [+0.5] of averages, highest since 2011 rank 12. The highest maximum was 11.2C on the 27th (-1.4) and the lowest 6.3C (+2.5) on the 13th. The mean minimum was 3.7C (+1.1) & [+1.5] of averages, highest since 2011 rank 8, the lowest minimum was 1.4C (-0.9) on the 1st with a cooler spell 10 - 12th with 1.5C, 1.6C and 1.8C respectively. The lowest grass minimum was -3.6C on the 16th and there were 13 days (-1.9) of ground frost. Rainfall was above average. In Llansadwrn rainfall totalled 128.2 mm (183%) & [163%] of averages, most since 2002 ranking 15th since 1929. Largest falls were 30.3 mm on the 12th and 27.7 mm on the 22nd. There was just one day on the 13th with no precipitation and 3 dry (<0.2 mm) days. Rain days numbered 25 (+8.4) and wet days 18 (+7.0) while there were 7 days (+2.6) having 5 mm, or more. There were 161 wet hours duration with over 10 hours recorded on 4 days including 20 hours on each of the 14th and 23rd. Sleet and snow was observed on 3 days (-0.8) in the cooler spell 10 - 12th and small hail on 8 days (+2.8), thunder was heard on the 8th. Winter 2013/14Temperature The mean temperature 6.5C (+1.1) & [+1.3] of averages, was highest since 1995 and ranked 2nd since records began in 1979. Winter rainfall totalled 444.7 mm (144%) & [148%] of averages, largest since 2000 and 5th largest since records began in Llansadwrn in 1929.
Air frosts
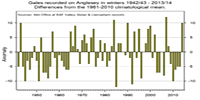
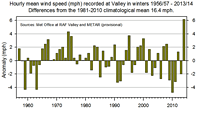
Anglesey winds The number of gales recorded for Anglesey in winter 2013/14 were provisionally 23 (+13.1) & [+10.0] of averages, highest since the 25 in winter 2006/07 ranking 4 since 1956/57 (graphic left). The provisional mean wind speed at RAF Valley 22.6 mph (+6.2) & [+8.4] was exceptional, the highest on record (graphic right).
March 2014Above average temperature, rainfall average on 30-y, but above the 10-y averageWet and windy at times, a few cool days, frequent ground frosts
Rainfall 84.3 mm (126%) and [99%] was largest since 2010 and ranked H28 in Llansadwrn since 1928. Largest falls were 21.8 mm on the 20th and 16.8 mm on the 6th. There were 11 (-4.3) dry days of which 6 (-2.8) had no precipitation. Rain days were 20 (+4.3) and 11 (-0.7) wet days. There were 5 (+0.3) days having 5 mm, or more. Sunshine at RAF Valley was 121.9h (92%) & [108%] of K&Z adjusted averages. Sunniest since 2012 and ranking 35th on the Anglesey record since 1931. The sunniest day was on the 11th with 10.9h and there were 3 sunless days.
April 2014Warmest since 2012, 4th warmest since 1942; driest since 2010, 20th lowest since 1928; average sunshine of the last decade.Cool dry spell in the middle of the month
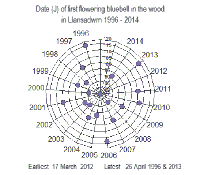
Rainfall was 40.3 mm [((64%)] of average and was least since 2010 and one of the 20 driest April's since 1928. The largest fall was 9.4 mm on the 7th one of 5 (+1.0+ having 5 mm, or more in the month. The were 12 days (+1.6) with no precipitation and 20 (+5.7) days were dry (<0.2 mm). There were only 10 rain days (-5.7) and 7 (-3.9) wet days. The first bluebells were seen in the wood on the 4th, 22-days earlier than last year (2013) and 3-days earlier than the median date of flowering (graphic left).
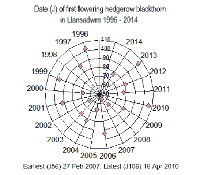
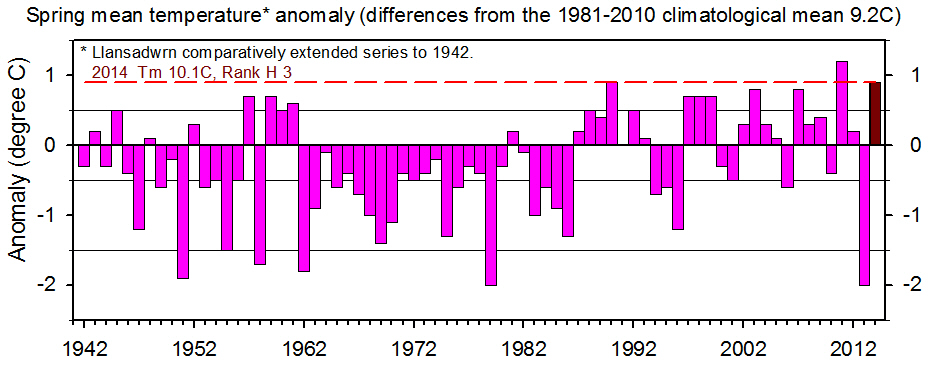
May 2014Rainfall and temperatures above average. Dull.Starting dry then 3 spells of heavy rain including a thunderstorm. Generally dull, but there were some very sunny daysRainfall 112.4 mm (176%) & [181%] of averages was largest since 2006 and one of the 10 wettest Mays on record in Llansadwrn since 1928. The wettest day with 27.2 mm was on the 19th in a thunderstorm that included a fall of large snow pellets. Days with 5 mm, or more, were 8 (+3.9) of average. There were 9 days (-2.2) with no precipitation; 14 (-0.9) dry days; 17 ( +0.9) rain days; and 12 (-0.2) wet days. Rainfall in Llanfairfechan, Gorwel Heights, was 140.2 mm. Largest falls were 25.8 mm on the 19th; 23.0 mm on the 22nd; 22.4 mm on the 23rd and 17.8 mm on the 10th. The Met Office website gives an average (derived) rainfall in Llanfairfechan for May of 60.8 mm, based on this value the rainfall this May was 231%. The rain was very heavy at times up to 52 mm/h on the 19th; 50 mm/h on the 23rd; 40 mm/h on the 8th. In 1967 141 mm was recorded at Penyffridd, Bangor, and 136 mm in Llansadwrn. In Llansadwrn in 2003 148.3 mm was recorded the largest in May since 1928. Minimum temperatures were above average although maxima were below average. The mean maximum was 15.2C (-0.1) & -0.7] and the mean minimum 8.9C (+1.1) & [+1.4] . The mean 12.1C (+0.5) & [ +0.3] was equal highest since 2008 ranking 10th highest since 1979. The highest maximum was 19.1C on the 31st and the lowest minimum 6.7C on the 13th. The lowest grass minimum was 2.3C on the 14th. Sunshine at RAF Valley was 157.8h (77%) & [81%] of K&Z adjusted values, lowest since 2003 ranking 16th on the Anglesey record since 1931. The sunniest day was on the 21st with 15.2h and there were 7 sunless days. Spring 2014Spring was remarkable because of its above average temperatures in contrast to spring 2013. White flowers of blackthorn were in hedgerows on the 17th. The earliest flowering date in my records is the 27 February 2007 and the latest 16th April 2010. The median flowering date is the 22 March, 5 days earlier this year and 28 days before last year (2013)
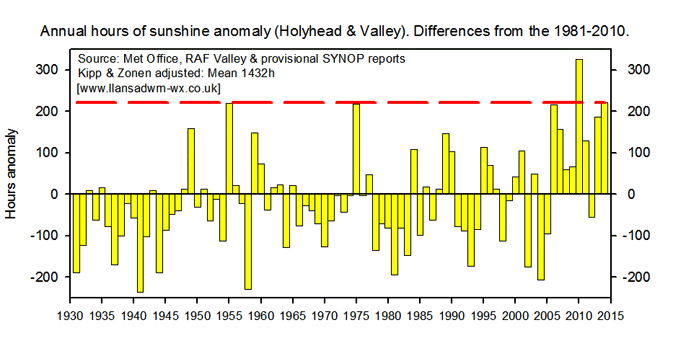
June 2014Sunniest June on record, above average temperatures with rainfall a little below averageWet and stormy at the beginning and wettest day at the end, warm and sunny in the middleThe 263.9h of sunshine recorded at RAF Valley was the most on the Anglesey record back to 1931! The sunniest day was on the 20th with 15.4h duration with 16 days having 10h, or more. There were no sunless days recorded although just 0.1h was recorded on the 28th; in all there were 3 days with <1 h. A mean solar radiation of 18.99 MJ m -2 was recorded in Llansadwrn, the brightest day was on the 23rd with 26.67 MJ m -2 and the dullest on the 2nd with 7.56 MJ m -2 and 28th that was sunless with 8.17 MJ m -2 . Rainfall was 62.5 mm, most since 2012 and and middle of the road on the totals list ranking 43 in Llansadwrn since 1929. The wettest day was on the 27th with 20.6 mm while 13.5 mm fell on the 6th. There were 17 days (+4.6) with no precipitation and the soil surface was dry on 12 mornings. Dry days numbered 16 (+2.7) and rain days 12 (-2.7). Wet days numbered 8 (-3.2) and 3 days (-1.9) had 5 mm, or more. It was drier at Gorwel Heights with 43.0 mm. The wettest day was on the 27th having 19.2 mm and only only 3.6 mm was recorded on the 6th that was wet in Llansadwrn. There were 52 wet hours recorded in Llansadwrn and only 36 at Gorwel Heights. Gorddinog recorded 56.6 mm the wettest day being on the 4th with 13.7 mm. The mean temperature in Llansadwrn was 14.7C, highest since 2010 ranking 8th highest since 1979. The mean maximum was 18.4C (+0.5) & [+0.6] of averages. Highest was 23.2C on the 18th and lowest 14.4C on the 4th and 28th. The highest maximum at Gorwel Heights was 22.1C on the 12th and at Gorddinog 21.2C on the 6th. The mean minimum in Llansadwrn was 10.9C (+0.3) & [+0.9] of averages, the lowest was 6.3C on the 6th that also had the lowest grass minimum of 2.3C. The lowest minimum at Gorwel Heights was 8.3C also on the 6th. There was a thunderstorm on the 7th between 0615 and 0700 GMT with a spell of very heavy rain (up to 124 mm/h at 0630 GMT) and 5 - 7 mm hail accumulating 13.5 mm. July 2014Below average rainfall with sunshine and temperatures above averageCool and stormy at the beginning, sunny and warmer at the endIt was another very sunny month on Anglesey. Sunshine duration recorded at RAF Valley was 250.7 h the 4th sunniest July on the Anglesey record since 1931 (K&Z adjusted values). This follows on from July last year that was the sunniest of any month (311.4h) and June this year that was the 5th sunniest of any month (263.9h). The sunniest day was on the on the 1st; there were 11 days in the month with 10h, or more. There were 2 sunless days. In Llansadwrn the mean global solar radiation was 16.46 MJ m -2. with the highest 25.79 MJ m -2. on the 1st of the month. The dullest day day was on the 19th with 5.63 MJ m -2 and was sunless. The brightest hour was between 12 & 13 GMT on the 11th having 870 W per m-3 . Rainfall was 58.6 mm (62%) & [84%] of averages, lowest since 2012 and ranking 30 in Llansadwrn since 1928. It was wetter in Llanfairfechan at Gorwel Heights having 88.8 mm [151%]. Wettest days were 18.2 mm in Llansadwrn and 18.8 mm at Gorwel Heights on the 4th; Gorwel Heights had another large fall of 20.2 mm on the 8th when only 2.8 mm fell in Llansadwrn. Wet hour durations were 71 in Llansadwrn and 58 in Llanfairfechan. There were 13 (+2.7) days with no precipitation in Llansadwrn and 15 (+1.3) dry days. Rain days were 18 (-1.3) and wet days 12 (-1.7). There were 3 (-3.2) days with 5 mm, or more. The mean temperature was 16.7C (+0.8) & [+0.9] of averages ranking 9th highest since 1979, but less than July last year. The mean maximum was 20.4C (+1.0) & [+0.9] of averages. The highest maximum 26.0C(+0.5) was on the 18th while the lowest maximum 15.9C (+1.1) was on the 4th. The mean minimum was 12.9C (+0.6) & [+0.9} of averages. The lowest minimum was 10.1 (+1.5) on the 5th and the lowest grass minimum 5.4C (-.2) was on the 10th. Highest minima - at 0000 GMT on the 24th the temperature was 18.2C falling to a minimum of 17.0C, highest of the month, at 0530 GMT in Llansadwrn. In Llanfairfechan it was even warmer - in a persistent SE'ly Föhn-like breeze off the mountains, through the evening of the 23rd to morning of the 24th, minima were 21.0C (screen) at Gorddinog and 20.5C (AWS) at Gorwel Heights, highest of the month. Mean wind speeds reached 18 mph at Gorddinog and 14 mph at Gorwel Heights gust speeds attaining 32 mph and 26 mph respectively. The mean relative humidity at Gorwel Heights from 2000 GMT on the 23rd to 0900 GMT on the 24th was 60%. In contrast it was calm in Llansadwrn from 1930 GMT on the 23rd to 0620 GMT on the 24th with mean relative humidity of 80%. Thunder was heard on 2 days (-0.5), the 7th and 18th. Small hail fell on 2 days (+1.8)... August 2014Sunny with below average temperatures with close to average rainfallA changeable month sometimes sunny and warm sometimes cool and dull spells with several very wet daysFor the 3rd month in succession sunshine duration recorded at RAF Valley was above average. The 184.3 h duration, (122%) & [115%] of averages, was sunniest since 2005 ranking 12th highest on the Anglesey record since 1931. There was just 1 sunless day, but 3 more had just 0.1h. The sunniest day was on the 4th with 14.3h with 6 days having 10h, or more sunshine. Rainfall was 95.1 mm (93%) & [109%] of averages, least since 2011. The wettest day was on the 25th with 18.0 mm. No precipitation was recorded on 5 days (-2.4) and there were 9 dry days (-3.0). Rain days were 22 (+3.0) and wet days 14 (+0.9). There were 7 days with 5 mm (+1.1), or more, of which 4 had 10 mm, or more. Gorwel Heights just missed the 100 mm mark having 99.8 mm [118%]; wettest days were the 5th with 19.0 mm and the 25th with 25.2 mm. Temperatures were below average with the mean 14.5C (-0.9) & [-1.1] of averages lowest since 1993. The highest maximum was 21.3C on the 8th and the lowest minimum 6.9C (-1.5) and the lowest grass minimum 2.8C (-2.1) on the 23rd. Thunder was heard on 1 day on the 5th at 2320 GMT and 2335 GMT preceded by spell of heavy rain 23 mm/h at 2317 GMT; no hail was recorded this month (-0.2). Summer 2014Summer temperatures were close to averages while rainfall was below average.
September 2014Sunny, with near record low rainfall total and high temperaturesVery dry at the beginning and middle of the month It was the driest September since 1986 and the 2nd driest on Llansadwrn records since 1928: The Met Office said that over Britain as a whole it was driest since 1910. The 14.7 mm here (13%) & [15%] of averages was second only to the 11.7 mm of rain recorded at this station in 1986. The wettest day was on the 23rd with 9.6 mm. There were 20 days (+12.2) with no precipitation and 24 dry days (+16.2) those with <0.2 mm rain. There were 6 (-11.7) rain days (>=0.2 mm) and just 2 wet days (-11.0) those with 1.0 mm, or more. There was just 1 day (-6.1) with 5 mm, or more. The mean temperature 15.3C (+1.3) & [+1.5] of averages was highest since 2006 and 2nd highest since before 1979. The mean maximum was 19.2C (+2.2) & [+1.9] of averages, the highest maximum 23.7C (+0.8) was on the 18th. There were 9 days with 20C, or more. The lowest maximum was 15.9C (+3.7) on the 23rd, highest since 2005. The mean minimum 11.4C (+0.4) & [+1.1] of averages, equal highest with 2011 since 2006, ranked 6th. The highest minimum 15.7C (+0.6) was on the 4th. The lowest minimum of 8.2C on the 8th, highest since 2006 ranked 2nd. The lowest grass minimum 3.4C (+0.5) was on the 27th. It was the 4th consecutive month with above average sunshine at RAF Valley. The 174.2 h of sunshine was highest since 1949 on the Anglesey record (K&Z adjusted), and ranking 3rd with 1933 in 2nd place. There were 3 days with 10h, or more; the sunniest day was on the 10th having 11.5h, there were just 2 sunless days. October 2014A wet month with temperatures above average with a record Halloween Day highSunniest, but wettest and stormy at the beginning. Generally warm throughout. The month will be remembered for the record breaking Halloween Day temperature on the 31st with many parts of SE England (Gravesend 23.6C) and the N Wales coast (Llanfairfechan, Gorwel Heights 22.6C and Gorddinog 22.3C) having in excess of 20C. The month was above average, but not a record breaker. In Llansadwrn the mean was 12.2C, lowest since 2012, ranking 7th warmest since 1979. The highest mean was 17.1C on the 31st and the lowest 9.8C on the 7th and 21st the only days <10C. The mean maximum was 14.8C (+0.5) & [+0.8] of averages, lowest since 2012 rank 7 since 1979. Highest maximum was 19.8C AWS and 20.1C in the Stevenson Screen on the 31st, lowest maximum 10.9C on the 21st. The mean minimum was 9.6C (+0.7) & [+1.3] of averages, lowest was 6.2C (+2.5) on the on the 29th and highest minimum 14.3C on the 31st was a record high on this day, but not for October as highest is 16.4C on 1 Oct 1985. The lowest grass minimum was 0.6C on the 5th. A wet month with rainfall of 203.5 mm, (135%) & [158%] of averages, largest since 2008 and ranking 9th in Llansadwrn since 1928. One of the wetter months of the year, there have been 56 Octobers with >100 mm recorded in Llansadwrn. The wettest day was on the 3rd with 57.1 mm, the 2nd largest daily fall in October at this station; the largest recorded was 86.0 mm on 22 October 2004 when Beaumaris was flooded. Despite the heavy rain at times there were 5 days (-2.0) with no precipitation and 6 (-4.1) dry days. Rain days numbered 25 (+4.1) and wet days 20 (3.9). There were 12 days (+3.7) having 5 mm, or more. There were c 88.0h of sunshine at RAF Valley (94%) & [90%] of average highest since 2012 and ranking 36th lowest in October on the Anglesey record since 1931. The sunniest day was on the 2nd with 10.4 h and there were 6 sunless days reported. There was no sunshine record reported on the 22nd (unusual). It was a dull day with Aberporth reporting 0.4h sunshine and Isle of Man nil. So... we will have to wait on official records to eventually appear for final statistics.
November 2014Sunniest November on Anglesey record, above average temperatures and fairly dryA wet and stormy beginning then quite dry with sunny days towards the end
Rainfall was on the low side for November, the 73.7 mm of quite adequate rain was nevertheless (59%) & [58%] of averages. The wettest day was on the 3rd with 13.4 mm. There were 2 (-2.6) days with no precipitation and 10 (+2.1) dry days, there being unusually 8 days of trace amounts due to small amounts of rain (3) or dew and frost deposition (5) the latter being not insignificant, but not always recorded by standard raingauges. When dew/ condensation was heavy the black funnelled AWS TBR, rim 30 cm above ground, tipped (0.2 mm) on the mornings of the 16th when there was a spot in the bottle of the copper raingauge, and 21st when copper gauge bottle was dry and drosometer measured 0.11 mm. On the 24th, when frosty, 0.24 mm was measured by drosometer and 0.32 mm on the 29th . Rain days were 20 (-2.1) and wet days 14 (-3.5). Days with 5 mm, or more, numbered 6 (-2.3). Rainfall at Gorwel Heights was 82.6 mm [60%] with the wettest day 12.6 mm on the 4th when a burst of rain fell at a rate up to 79 mm/h. There were 94 wet hours duration. There were 13 dry days and 17 rain days. Wet days were 15 and 5 had 5 mm, or more. Temperatures were above average. The mean ranking 6th highest since 1979 was 9.0C (+0.6) & [+1.3] of averages. The highest mean was 11.8C on the 1st and the lowest 6.2C on the 26th. The mean maximum 11.7C (+0.4) & +[1.3] was highest since 2011 ranked 5, the highest was 14.4C on the 15th. The mean minimum 6.2C(+0.7) & [+1.2] was again highest since 2011 ranked 6, the lowest 2.2C (+1.9) was on the 24th that also had the lowest grass minimum -3.3C. There were no air frosts (there had been just 3 so far this year), but there were 7 ground frosts (63 so far this year). The mean temperatures at Gorwel Heights was 10.0C [+1.2] and +1.0 compared with Llansadwrn due largely to Föhn-like winds off the mountains often at night in the absence of solar radiation. The mean maximum was 12.1C was +0.4 compared with Llansadwrn and the mean minimum 7.9C +1.7 compared with Llansadwrn. The highest maximum was 15.3C on the 6th in a Föhn-like wind at 2010 GMT and the second highest 15.1C in another Föhn-like wind between 2230 and 0220 GMT overnight 21/22nd. The lowest minimum was 4.6C on the 4th. Thunder occurred on the 2nd and small hail fell on just 2 days, the 2nd and 4th, (-4.5d) of average, Autumn 2014Autumn temperatures were above averages ranking 3rd highest since before 1979. Rainfall was below the averages ranking 26th lowest since before 1928
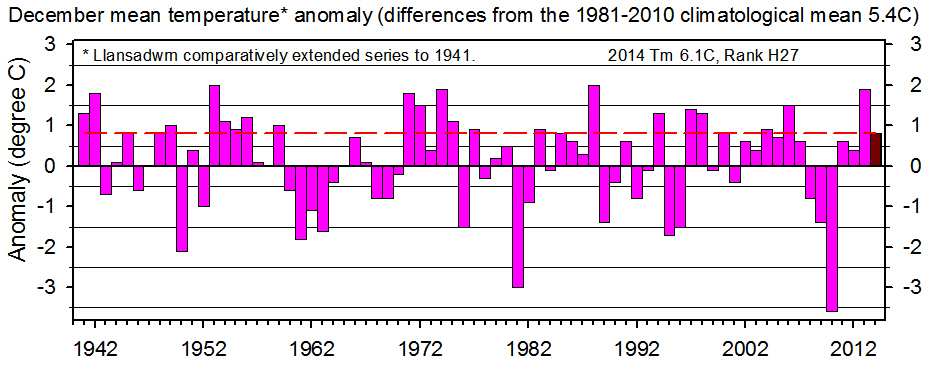
December 2014Mild: Temperatures above average, no air frost; rainfall average and no lying snowGenerally mild with a few colder interludes with wintry showers throughout Continuing on the mild theme the mean temperature was 6.1C, highest since 2012 and ranking 12th since 1979 and 27th since 1941, was (+0.6) & [+0.8] of averages. Not among the highest of December means, but enough to ensure the annual average topped the table (see below). The highest maximum was 11.2C on the 18th was nothing remarkable (-0.3) on the decadal average; 8 days had 10C, or more. The lowest maximum was 4.3C and was interesting as it was (+1.3) of the decadal average. The mean minimum was 3.8C lowest since 2012 ranking 13th since 1979, (+0.6) & [+0.9] of averages. The lowest minimum was 0.0C (+2.2) on the 29th and therefore there were no air frosts. The highest minimum was 10.1C on the 18th (+1.0) not far ahead of the 10.0C on the 23rd the 2 days with double digits. Ground frosts were 18, the lowest -5.2C (+1.3) on the 29th. At Gorwel Heights the mean temperature was 7.1C [+0.5] of average with highest maximums of 13.4C on the 18th and 22nd were Föhn-enhanced. The lowest maximum of 4.9C occurred on the 27th. The highest minimum (09-09 GMT) was 10.8C on the 23rd, but there was a Föhn-enhanced 12.0C high minimum (00-00z) on the 22nd at 0820 GMT - it all depends on the timing... Rainfall was pretty average with a total of 125.3 mm (93%) & [104%] of averages. The wettest day was on the 16th with 22.3 mm and another 5 days had 10 mm, or more. Days with no precipitation numbered 4 (-1.8) while dry days (having <0.2 mm) were 9 (-1.4). Rain days (having 0.2 mm, or more) were 22 (+1.4). Wet days (having 1.0 mm, or more) were 18 (+1.3) and days having 5 mm, or more were 8 (-1.7) indicating a paucity of heavier falls this month. Wet hour duration was 137. At Gorwel Heights the rainfall was 136.2 mm [104%] of the 30-y average, with the wettest day 23.8 mm on the 11th, and 161 wet hours duration. Dry days were 8, rain days 23 and wet days 21. There were 10 days that had 10 mm, or more.. In contrast to November it was a rather dull month. At RAF Valley there were 43.5h of sunshine (97%) & [92%] of averages. The sunniest day was on the 28th with 5.1h and there were 11 sunless days, highest monthly total this year beating the 10 in January. Small hail (mostly snow pellets) was seen on 12 days (+2.6), sleet on 1 day and snow flakes on 2 days in association with showers of snow pellet showers. There was no lying snow.
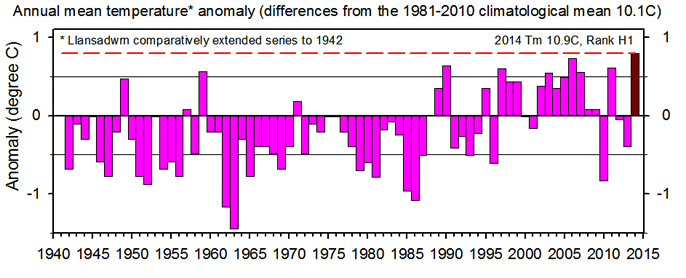
Annual 2014The warmest year on record.
Monthly data 2014, Llansadwrn
Gorwel Heights, Llanfairfechan observations
AcknowledgementsThe Met Office at RAF Valley kindly supplied observational data from 1942 to 2011. Current data (provisional) are gathered from SYNOP reports and METAR. I am grateful to David Lee for use of data from Gorddinog and deputy observers Fran and Evan Hennessey for help making observations.
| |||||||||||||||||||||||||||||||||||||||||||||||||||||||||||||||||||||||||||||||||||||||||||||||||||||||||||||||||||||||||||||||||||||||||||||||||||||||||||||||||||||||||||||||||||||||||||||||||||||||||||||||||||||||||||||||||||||||||||||||||||||||||||||||||||||||||||||||||||||||||||||||||||||||||||||||||||||||||||||||||||||||||||||||||||||||||||||||||||||||||||||||||||||||||||||||||||||||||||||||||||||||||||||||||||||||||||||||||||||||||||||||||||||||||||||||||||||||||||||||||||||||||||||||||||||||||||||||||||||||||||||||||||||||||||||||||||||||||||||||||||||||||||||||||||||||||||||||||||||||||||||||||||||||||||||||||||||||||||||||||||||||||||||||||||||||||||||||||||||||||||||||||||||||||||||||||||||||||||||||||||||||||||||||||||||||||||||||||||||||||||||||||||||||||||||||||||||||||||||||||||||||||||||||||||||||||||||||||||||||||||||||||||||||||||||||||||||||||||||||||||||||||||||||||||||||||||||||||||||||||||||||||||||||||||||||||||||||||||||||||||||||||||||||||||||||||||||||||||||||

