|
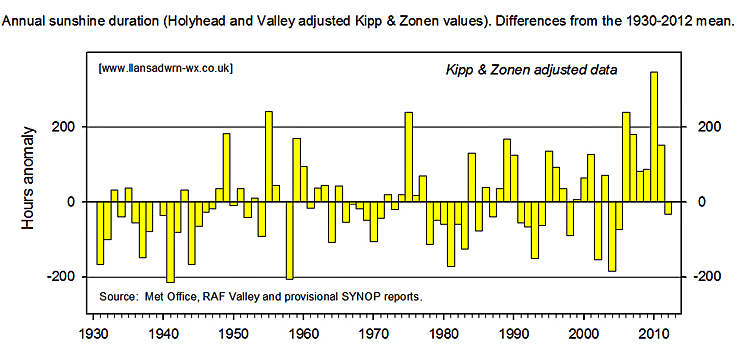
January 2012Mostly mild with below average precipitation and fairly sunnyWindy at the beginning, cooler in the middle and at the end of the month The mean temperature was 5.9C, highest since 2008, with anomalies of (+0.5) based on the decadal & [+0.8] on the 1981-2010 average. The mean ranked 9th highest since 1979. The highest mean 9.4C was on the 1st and the lowest 0.1C on the 31st. The mean maximum of 8.2C, also lowest since 2008, was (+0.4) & [+0.6]. The highest maximum 10.9C (-0.8) was on the 2nd and the lowest 1.7C (-0.8) on the 31st. The mean minimum 3.7C (+0.7) and [+1.1] was particularly elevated. The highest 9.1C (+0.4) was on the 1st while the lowest -1.4C (+0.9) occurred on the 16th and 31st. There were 4 airfrosts (-1.2) in Llansadwrn of 37.1h duration, but none were recorded at Gorwel Heights. The lowest grass minimum in Llansadwrn was -6.1C (+0.2) was on the 16th and there were 15 days with ground frost (+1.6). At Gorwel Heights in Llanfairfechan the mean maximum temperature was 8.8C {+0.6 on Llansadwrn} and the highest 13.9C on the 17th {+3.9 on the day and +3.0 compared with the highest Llansadwrn temperature on the 2nd}. The mean minimum was 5.0C {+1.3} with the lowest 0.4C on the 31st {+1.8}. The enhanced temperatures compared with Llansadwrn are partly the result of Föhn-like winds, and other effects, due to Llanfairfechan's position in the lee of the Snowdonia mountains. In the case of the 13.9C maximum on the 17th (09-09z) this occurred at 0430 GMT on the 18th, the maximum in Llansadwrn 9.9C also was at 0430 GMT while on the summit of Snowdon it was 4C. In the previous hour the dominant SSW'ly wind at Gorwel Heights was between 9-23 mph and in Llansadwrn the dominant SW'ly was between 12-21 mph and on Snowdon the dominant SW'ly was between 33-46 mph. During the month the (seemingly) unusually large number of nocturnal (2100-0900 GMT) maximum temperatures occurred 17 times at Gorwel Heights and 10 times in Llansadwrn. First indications are that the 13.9C was the highest on this day (ending 0900 GMT on the 18th), beating Plymouth 11.4C. Later during the day (18th) Exeter AP reported 13.9C, Hawarden 12.4C and Rhyl 12.1C. The Gorwel Heights maximum was 11.7C at 0910 GMT. The highest temperature recorded in Britain on the 17th of January was 17.2C in Colwyn Bay in 1920, on the 18th January 16.1C was recorded at Gordon Castle in 1932, but there is a 13.9C record still to beat as this is the highest on the 25th January recorded at Nantmor (Gwynedd) in 1997. Rainfall was below the January averages, the 86.4 mm in Llansadwrn was (81%) & [85%] of average, ranking 33rd lowest since 1929, but was highest since 2009. The largest fall was 15.7 mm on the 25th and the only other fall in double figures was 11.4 mm on the 22nd. Gorwel heights had 75.0 mm with 13.4 mm on the 25th and 11.0 mm on the 4th. In Llansadwrn there were only 3 days without any precipitation, and 9 dry days (having <0.2 mm). There were 22 (+2.2) rain days (>= 0.2 mm) and 17 (+1.6) wet days (>= 1.0 mm). Llanfairfechan had 9 dry days, 22 rain days and 15 wet days. Days with 5 mm, or more were 6 (-1.4) in Llansadwrn and Llanfairfechan. Highest rates of rainfall were 68 mm/h in Llanfairfechan on the 4th and 52 mm/h on the 1st in Llansadwrn. At Valley sunshine duration was 55.8 h (92%) and [96%} of average despite there being 9 sunless days. Sunshine was lowest since 2008 and ranked 39th on the Anglesey record since 1930 (Kipp & Zonen adjusted values). The sunniest day was on the 16th having 6.9h. Valley recorded gales on the 3rd and 5th. The highest gust at Valley was 69 mph on the 3rd while 58 mph was recorded at Llansadwrn and 47 mph in Llanfairfechan.
February 2012Below average rainfall with average or above average temperatureColder and drier at the beginning, warmer and wetter at the end. Dull. The second month with below average rainfall. The 67.4 mm, least since 2010 with 46.2 mm, was (85%) and [86%] of averages. The wettest day was on the 9th having 12.5 mm. The were 6 days (+1.5) with 5 mm, or more. Rain days were 19 (+2.2) and wet days 11 (-0.5). There were 10 (-1.4) dry days and 3 (-3.0) had no precipitation at all. The mean temperature was 5.6C, lowest since 2010 and middle of the road in the rankings. The average hides the contrast in the two halves of the month
particularly in minimum temperature, hours of frost duration, and number of air and ground frosts. While the first half was not dry, the second half was wetter. Overall the mean maximum was 8.3C, (-0.2) and [0.0], the highest 14.2C (+1.6) on the 23rd. The mean minimum was 2.9C (+0.2) and [+0.7], the highest 8.5C (+1.6) was on the 23rd. The lowest minimum was -4.3C (-2.8) on the 3rd that also had the lowest grass minimum -9.2C (-3.3). There were 7 air frosts with a duration of 93.9 h and 13 (-1.9) ground frosts. At Gorwel Heights in Llanfairfechan the mean maximum was 8.7C, the mean minimum 4.3C and the mean 6.5C. The highest maximum was 17.2C on the 23rd and the lowest minimum -2.4C on the 3rd. Provisional data for Valley indicate the 5th lowest sunshine on the Anglesey record since 1930. The 48.2 h duration, lowest since 2009, was (59%) and [60%] of averages. The sunniest day was on the 1st having 8.1h. There were 14 sunless days, 9 consecutive 9 - 17th.
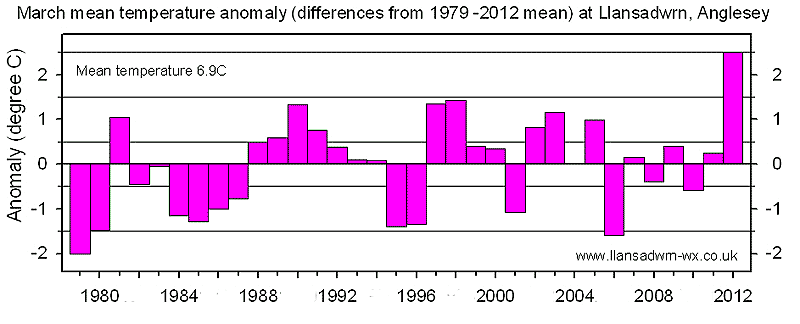
March 2012Warmest on record with rainfall below average. Sunny.The beginning was cool and somewhat wetter, the end was remarkably warm and sunny.
Rainfall of 38.6 mm ranked 17th lowest in March since 1928, and rank 129th lowest any month in the year. Most since 2010, rainfall was (58%) of the decadal, but [45%] of the 1981 -2010 climatological average. The wettest day was on the 16th with 13.3 mm, but wettest day at Gorwel Heights was on the 3rd with 16.4 mm. Here there were 16 (+6.8) days with no precipitation and there were 25 (+10.4) dry days (23 days at Gorwel Heights). Rain days were 6 (-10.4) and wet days 4 (-7.8). There were 4 days (-0.2) days with 5 mm, or more. Evaporation, however measured, was high for March. By lysimeter PE was 37.7 mm with a PWB of 0.9 mm and a PWD of 22.4 mm. Soil moisture under grass began the month just below saturation at 63% dry mass and ended on 58% dry mass. The surface of the bare plot was dry at 0900 GMT from the 26th to the end of the month and on to 2nd April. There were 14-days with measurable rain from the 18th to the end of the month needing 1 more day for a drought that was arrived at in April. It was a particularly sunny end to the month with high solar radiation generally from the 18th, spoiled by sunless days on the 21st and 22nd. Highest solar radiation was on the 28th with 16.23 MJ m -2 while the brightest hour was from 1200 GMT on the 27th receiving 669 W m -2 . Provisional data from Valley indicated 147.4 h duration with 6 sunless days. Sunniest with 11.7h were the 27th and 28th. April 2012Cool, wet and less sunny than usual. Very wet in Llanfairfechan.Somewhat colder at the beginning with snow falling, wet and very windy towards the end.After the drought in many parts of southern Britain it was the wettest April on record. Here, we have seen wetter Aprils, but the 100.1 mm of rain was (159%) & [158%] of average, the most since 2005 joining 8 other Aprils since 1928 recording over 100 mm: largest was 1970 with 147 mm. Wettest day was the 29th having 14.4 mm. There were 4 (-7.2) days with no precipitation and 8 (-7.4) dry days. Rain days were 22 (+7.4), wet days 13 (+2.4) while 8 (+3.8) had 5 mm, or more. Wet hours were 133. Rainfall at Gorwel Heights in Llanfairfechan was 149.8 mm. Largest fall was 26.4 mm on the 29th, there were 8 dry days, 22 rain days, 18 wet days and 8 had 5 mm, or more. Wet hours were 151. Probably the wettest since 1970 when Gerlan had 248 mm; Penrhyn Quarries 234 mm; Bangor Town Hall 172 mm and Penyfridd 165 mm. Other large rainfalls in North Wales in April 1970 included Snowdon, Delta 660 mm; Snowdon, Crib Goch 597 mm; Snowdon, Llydaw Mine 564 mm & Llyn Llydaw 464 mm. Anglesey large rainfalls included Plas Cadnant 150 mm; Talwrn 148 mm; Llansadwrn 147 mm and Brynsiencyn 134 mm. Average temperatures were all lower than March. The mean temperature 7.5C (-2.2) & [-1.4] of averages was lowest since 1986 ranking 3 in records since 1979. The mean maximum 10.8C (-2.8) & [-2.1] ranked 2 just 0.1 higher than the lowest recorded in 1986. The highest maximum was 15.9C on the 30th, this (-4.0) of the decadal average. The mean minimum was less divergent from the average the 4.2C (-1.7) of the decadal, but [-0.7] of the 30-y average. There was just 1 air frost, briefly falling to -0.1C (-1.0) on the 5th that also recorded the lowest grass minimum of -3.4C (-0.7). There were 9 ground frosts up (+3.6) on average. The mean soil temperature at 30 cm depth was 9.7C (-0.9), but at 100 cm the mean 10.1C was (+0.1). Sunshine duration at Valley 144.6 h was (83%) & [92%] of average. The sunniest day was on the 5th with 12.0 h, the 1st with 10.6h and the 12th with 10.1h were the only other days to reach double figures. There were 5 sunless days. In Llansadwrn the highest global solar radiation was recorded on the 28th with 22.01 MJ m -2 with the brightest hour from 1200 GMT 819 W m -2 .The dullest day was on the 25th with 3.30 MJ m -2 . May 2012A month of contrastsWet and cold at the beginning, hot and dry at the endThe mean temperature was 11.3C [(-0.4)] of averages, was lowest since 2010. The mean maximum 15.3C (-0.1) & [-0.6] of average. The highest maximum was 26.6C (+3.2) on the 26th and the lowest 9.0C (-1.6) on the 5th. The mean minimum was 7.3C (+0.7) & [-0.2], lowest was 1.4C (-2.1) on the 5th that also had the lowest grass minimum temperature of -2.0C. There were 3 ground frosts. Rainfall was 62.3 mm (85%) & [100%] of average, lowest since 2010. The largest fall was 24.2 mm on the 9th. There were 12 days (+1.1) with no precipitation and there were 17 (+2.8) dry days (<0.2 mm). There were 14 (-2.8) rain days and 9 (-4.4) wet days while 3 (-1.6) had 5 mm, or more. Provisional sunshine duration at Valley was 221.1 h [ (114%)] of average, most since 2010 and 14th highest in May on the Anglesey record since 1930 (K&Z adjusted values). The sunniest day was on the 26th having 15.2h and there were 4 sunless days. June 2012Unsettled, cooler and much wetter than average, stormy in many placesCool and wet throughoutA wet month, generally the wettest June for over 100 years. In Llansadwrn the 120.4 mm (177%) & [178%] of averages was largest since 2008 and ranked the 11th wettest June in records since 1928. The largest daily fall was 18.5 mm on the 15th and there were 9 days (+4.4) on which 5 mm, or more, fell. But, there were 6 days (-6.4) that had no precipitation and there were 8 (-7.7) dry days. Rain days numbered 22 (+7.7) and wet days 21 (+10.6). Wetter in Llanfairfechan with 178.6 mm where 14 days had 5 mm,or more. The largest fall was 26.6 mm on the 8th while 20.0 mm fell during the evening of the 14th. There were 8 dry days, 22 rain days and 18 wet days. Number of wet hours were 172, most 19 on the 8th with 15 and 17 on the 14th and 15th respectively. In Llansadwrn wet hours were 159, most 22 on the 15th, 16 on each of the 8th and 21st, and 13 on the 2nd. Rainfall in Capel Curig was 340.8 mm; Aberdaron 168.6 mm; Bala 165.8 mm; Aberporth 147.4 mm; and Valley 105.0 mm. A cool month. The mean temperature 13.1C (-1.3) & [-0.8] of averages, was lowest since 1994 and ranked 7th lowest since 1979 at this station. The mean maximum 16.1C (-2.0) & [-1.7] of averages, was lowest since 1991 and ranked 3rd lowest in my records. Spectacularly low was the highest maximum 19.5C on the 2nd was (-5.3) of the decadal average and 2nd lowest on record (1991 was 19.0C on 27/28th). The mean minimum was 10.0C (-0.7) & [-0.8] of averages. Lowest was 5.8C on the 4th while the lowest grass minimum 3.2C was on the 18th. At Gorwel Heights in Llanfairfechan on the 27th in Föhn-like conditions the temperature rose to 24.7C in a spell of 3 days on 26, 27 & 29th when 20C, or more, was reached. Sunshine was at a premium. At Valley provisional sunshine duration was 145.1h (76%) & [85%] of the K&Z adjusted values. On the Anglesey record sunshine was lowest since 2004 and ranked 16th lowest since 1930. The sunniest day was on the 19th with 12.9h and there were 11 sunless days. In Llansadwrn the highest global solar radiation was recorded on the 11th with 27.16 MJ m -2 with the brightest hour from 1100 GMT on the 4th of 912 W m -2 .The dullest day was on the 9th with 4.18 MJ m -2 .July 2012Cool, dull and wetRather mixed throughoutRainfall of 109.4 mm, (124% & [157%] of averages, was largest since 2010 and 16th wettest in Llansadwrn since 1928. Two days were the 6th and 13th were wettest with 20.5 mm and 20.3 mm respectively. Wet also at Gorwel Heights in Llanfairfechan with 141.2 mm, wettest day was on the 6th with 47.4 mm, largest daily fall in any month since records started here last year. David Lee also reported 46.1 mm in his standard gauge at his weather station in Llanfairfechan (2). In Llansadwrn only 4 days (-6.1) were without any precipitation. There were 10 dry days (-4.1). 21 rain days (+4.1), 17 wet days (+3.6) and 7 (+1.0) had 5 mm, or more. In Llanfairfechan there were 10 dry days, 21 rain days, 18 wet days and 9 had 5 mm, or more. Number of AWS recorded wet hours were 105 in Llansadwrn and 118 in Llanfairfechan. Temperatures were all below average. The mean 14.4C [(-1.4)] was lowest since 1998 ranking 2 in records since 1979! Maxima temperatures were particularly low with the mean 17.2C (-2.1) & [-2.3] of averages. The highest 21.8C on the 24th was (-4.2) of average over the last 10-years. Minima temperatures were also slightly below average (-0.8) & [-0.4], were highest since 2010 (12.7C), last year the mean minimum was 11.3C, but ranked 18th highest. The lowest minimum was 7.6C (-1.0) was on the 12th that also had the lowest grass minimum -4.1C (-1.3). Soil temperatures too were below average, at 30 cm the mean 16.3C was (-1.1) while at 100 cm the mean 15.2C was (-0.8). At Gorwel Heights there were Föhn-like events that enhanced the maximum temperature on the 17th, 23.2C (dewpoint 17.5C) at 1540 GMT, one of the highest in Britain on the day (Llanfairfechan (2) 22.6C, Hawarden 22.1C) and 25.7C on the 24th (Hawarden 26.1C, Llanfairfechan (2) 22.6C. The night 23/24th 24th also saw one of the highest overnight minimum temperatures 19.1C in a moist SSW'ly wind off the mountains with dewpoints around 16.2C and relative humidity around 82% RH. David Lee reported a minimum of 18.8C at his AWS in Llanfairfechan. These temperatures, probably the highest minima in Britain on the night of 23/24th being higher than Rhyl 17.7C, Crosby and Blackpool 17.1C, while Hawarden had 14.2C. A very dull month at RAF Valley the 112.0h sunshine duration lowest since 2002 ranking 6th lowest on the Anglesey record (K&Z adjusted values) since 1930. The sunniest day was on the 7th with 14.2h and there were 6 sunless days. In Llansadwrn with 10 sunless days the mean global solar radiation was 12.58 MJ m -2. The highest global solar radiation was recorded on the 7th with 22.48 MJ m -2 with the brightest hour from 1100 GMT on the 12th of 798 W m -2 .The dullest day was on the 16th with 4.45 MJ m -2 . August 2012Temperatures and rainfall a little above averages.Thundery outbreaks beginning and end of month. Two very wet days. Sunny at the beginning.Rainfall was 100.9 mm (111%) & [116%] of averages. Largest since 2009 and ranking 33rd in Llansadwrn records back to 1928; one of 39 Augusts to have 100 mm, or more. Wettest days were on the 17th with 24.5 mm and 20.0 mm on the 24th. There were 7 days (-0.8) with no precipitation and 7 dry days (-6.4). Rain days were 24 (+6.4) and wet days 16 (+3.6). There were 6 days (+0.4) with 5 mm, or more. Drier this month at Gorwel Heights, Llanfairfechan, with 74.8 mm, largest fall 12.6 mm on the 17th. There were 8 dry days, 23 rain days, 16 wet days and 6 had 5 mm, or more. Wind direction predominately SE/ S meant that Llanfairfechan was in rain shadow and sunnier on many days. This also had an influence on temperature, 19 days had a maximum of 20C, or more, with a 12-day spell 7 - 18th 20C, or more. Llansadwrn had 11 days 20C,or more including a 9-day spell 8 - 16th. Notable were the maximum temperatures on the 11th of 22.8C and 23.8C on the 13th. The mean temperature was 15.9C (+0.4) & [+0.3] the first month above average since March! Highest since 2004 and ranking 9th since 1979; highest mean 18.9C on the 11th and lowest 11.9C on the 31st. The mean maximum was 19.0C, highest since 2004, (+0.1) & [-0.2] of averages; highest maximum was 23.2C on the 11th and lowest 15.4C on the 30th. The mean minimum was 12.9C (+0.4) & [+0.3] of averages; highest 16.5C on the 18th and lowest 8.2C on the 31st. Lowest grass minimum was 5.8C also on the 31st. August was a poor month for sunshine in many places especially in the north. Aberdeen saw only 98.2 h 70% of average and Lerwick 90.7 h 79%. One of the sunniest was Manston in Kent with 207.3 h 104% of average. Shawbury had 128.3 h 85% so Valley with 175.7h (118%) & [109%] did rather well making up for low sunshine totals in June and July. Sunniest since 2005 and 18th on the Anglesey record since 1930 (K&Z adjusted values) the sunniest day was on the 9th having 13.7h. This was 1 of 3 consecutive days 8-10 with over 12 h (12.1, 13.7 and 13.5 h) and the 2nd with 12.0h. There was just 1 sunless day on the 17th. It was not so sunny in Llansadwrn there being 4 sunless days and generally cloudier being near the Snowdonia Mountains. Mean mean global solar radiation was 12.17 MJ m -2 lowest since April. The highest global solar radiation was recorded on the 10th with 23.39 MJ m -2 with the brightest hour from 1300 GMT on the 8th of 829 W m -2 , higher than in July. The dullest day was on the 15th with 3.48 MJ m -2 lowest since April. Thunder was heard on 3 days (+2.1) and small hail fell on the 29th (+0.7). A gust of 48 mph was recorded at Gorwel Heights on the 27th. Summer rainfall: Despite the Met Office reporting Wales and England summer averages largest for 100y the total here was 330.7 mm, most since 2007 ranking 9th in Llansadwrn records since 1928.
September 2012Wet and cool, near average sunshineSunny and warmer at the beginning turning very wet towards the end of the month and chasing the year 2000 record Very wet, particularly at Gorwel Heights in Llanfairfechan where rainfall was 213.2 mm, most in any month since records commenced in Mar 2011, bringing the total for the year up to 966.0 mm. The 3 days 23 - 25th had more than half the month's rain with 113.4 mm, largest fall was 50.8 mm on the 24th. Three other days had 25 mm, or more, 38.6 mm on the 10th, 37.6 mm on the 23rd and 25.0 mm on the 25th. Dry days were 11, rain days 19, wet days 16 while 9 had 5 mm, or more. In Llansadwrn rainfall was 161.6 mm, but brought the total for the year up to 847.1 mm just short of the 856.8 mm accumulated to September in 2000, the wettest year here since 1928. The wettest September since 2004 and ranking 10th largest. The largest fall was 49.5 mm on the 24th with 26.0 mm on the 25th. There were, however, 7 dry days (-2.3) these without any precipitation. Rain days were 23 (+6.9) and wet days 18 (+6.4).There were 7 days (+0.2) with 5 mm, or more. The mean temperature was 12.6C (-1.7) & [-1.2] of averages, lowest since 1995 rank 5. Highest means were 19.4C on the 2nd and 3rd, lowest was 9.1C on the 23rd. The mean maximum 15.5C (-2.1) & [-1.8] of averages was lowest since 1994, rank 2. Highest maxima were 19.4C (-4.0) well below normal on the 2nd and 3rd, lowest maximum was 10.7C (-2.5) on the 25th. The mean minimum 9.8C (-1.3) & [-1.2] of averages was lowest since 1995, rank 11. The highest minimum was 14.5C (-0.6) on the 4th, the lowest 4.7C (-2.2) was on the 22nd. The lowest grass minimum was 0.3C (-2.8), the lowest in September on record at this station. There was one day with thunder (+0.8) and 4 with small hail (+3.4) There were some very dull days in Llansadwrn with 5 sunless. Dullest was on the 24th, when thick cloud produced the wettest day of the month, with global solar radiation only 1.44 MJ m -2 . The next day the 25th was almost as dull with 1.53 MJ m -2 . The mean for the month was 8.55 MJ m -2 . The highest global solar radiation was recorded on the 8th with 16.43 MJ m -2 with the brightest hour from 1200 GMT on the 5th of 718 W m -2 . Despite 5 sunless days at Valley sunshine duration, 134.6h (106%) & [105%] of K&Z adjusted averages, was highest since 2006 ranking 23rd on the Anglesy record since 1930. The sunniest day was on the 5th having 10.5 h duration, the only day to reach double figures.
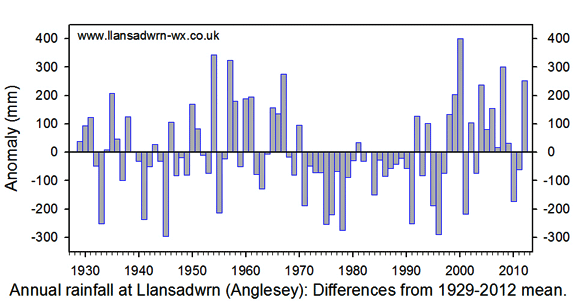
October 2012Below average temperatures and sunshine, near average rainfallTemperatures were below the averages with the mean 9.9C (-1.5) & [-1.0] lowest since 2003 and ranking 7 since 1979. The mean maximum 12.6C was (-1.8) & [-1.4] of averages, lowest since 1993 rank 5. The highest maximum 16.2C on the 21st was (-4.2) and the lowest 6.9C (-2.8) was on the 26th. The mean minimum was 7.2C (-1.1) & [-0.5] was equal lowest since 2008 ranking 12. The lowest minimum 3.3C on the 27th was on the 10-y average. The grass minimum averaged 4.2C (-1.4) and the lowest -0.1C (+0.5) was on the 4th the only ground frost of the month ending a frost-free period from running from May 13th (-1.0 on 12th May. Total rainfall was 127.8 mm (88%) & [99%] of averages, most since 2008 rank 37 since 1928. This brings the annual rainfall up to 974.9 mm above the long-term average of 840.4 mm, but below the total accrued in the wettest year 2000 of 1079.8 mm. October 2000 was very wet having 223.0 mm (the wettest October here was in 2008 with 282.8 mm). It was wetter this October at Gorwel Heights in Llanfairfechan where 141.2 mm fell bringing the annual total up to 1107.2 mm. The largest fall in Llansadwrn was 26.3 mm and in Llanfairfechan 26.6 mm, both on the 11th. In Llansadwrn there were 4 days (-3.7) without any precipitation and 8 (-2.8) dry days. Rain days were 23 (+2.9) and wet days 15 (-0.7). Days with 5 mm, or more, were 9 (+1.1). Number of wet hours were 135 in Llansadwrn and 118 in Llanfairfechan. There were 5 days with hail in Llansadwrn (+2.2) and thunder on 1 day (+0.1) the 3rd. Sunshine at Valley was 90.1 h duration (93%) & [92%] of K&Z adjusted averages, sunniest since 2010 but ranked the 39th lowest on the Anglesey record since 1930. The sunniest day was on the 21st having 9.7h and there were 5 sunless days. November 2012Above average rainfall with below average temperaturesGenerally wet and windy through the month The month ended with above average rainfall the 166.8 mm (126%) & [132%] of averages most since 2009 ranking 20th since 1928. Wettest day was on the 22nd with 45.5 mm. Rain days were 25 (+3.2) and wet days 19 (+1.4 ) while rainfall duration (wet hours) was 162. There were 8 days with hail (+2.3), 7 days small hail (ice pellets) and 1 large hail.. Thunder was heard on 2 days (+0.9). Temperatures finished below average the mean 7.3C (-1.1) & (-0.4] lowest since 2010 and soil at 30 cm deep averaged 8.2C (-1.0) and at 100 cm 10.1C (-1.0). There was no air frost, but there were 10 days of ground frost the lowest on the 29th being -3.5C (average). Sunshine at Valley was close to averages was lowest since 2009 (103%) & [109%]. The sunniest day was on the 15th with 6.3h duration. December 2012Mild and very wetTemperatures below average and 42% of normal rainfall in the first half of the month, mild second half and very wet By the middle of the month rainfall had already reached 42% of the December average total with 19.0 mm falling on the 6th. The second half was wetter with 6 days having 10 m, or more, bringing the total up to 192.9 mm (157%) & [160%] of averages by the end. Most since 2006, and the 7th largest December rainfall in Llansadwrn since 1928. The wettest day was on the 28th having 27.3 mm. Days with no precipitation were 4 (-2.8) and there were 7(-4.2) dry days, these are defined as days with less than 0.2 mm including days with trace amounts. Rain days, those with 0.2 mm, or more, were 24 (+4.2). Wet days, or more, were 22 (+6.3) and days with 5 mm, or more, numbered 14 (+5.3). Over the 34-years of observations here days recording 5 mm have increased on average by 10 a year. It was very wet in Llanfairfechan as well. Rainfall at Gorwel Heights totalled 231.2 mm with the wettest day 38.0 mm on the 14th. There were 196 'wet hours' in Llanfairfechan and 192 in Llansadwrn. Soils were water saturated for much of the month resulting in local fields and roads awash with water often after moderate amounts of rainfall. Heavy rain caused surface flooding and closure on occasion of the A55, original section of dual-carriageway between Abergwyngregin and Talybont needing work done on it, and stranding of hundreds of motorists and many school children and hospital staff in Bangor. Severe floods caused damage to property in the area including in St Asaph and Llanberis. Flooding of the mainline railway track for several days near Gaerwen, Anglesey, resulted in suspension of all trains. At one time Anglesey and parts of north-west Wales were more or less cut off from the rest of Britain; like bygone days it was easier to get to Dublin than London on the ferry from Holyhead! After temperatures started below average they were above average towards the end of the month. The monthly mean 5.8C [(+0.4)] was lowest since 2010, but still ranking 18th warmest in records since 1979. The mean maximum 8.2C (+0.5) & [+0.4] ranked 16th while the mean minimum 3.3C [(+0.4)] ranked 18th. The highest maximum 11.7C (-0.1) was on the 22nd that also saw a maximum of 13.5C at Gorwel Heights. The 28th maximum was 10.8C in Llansadwrn and 13.1C at Gorwel Heights. Annual 2012Dry at the beginning of the year to May, cool wet and dull later
Monthly data 2012
Llanfairfechan observations
AcknowledgementsI am very grateful to deputy observers Evan and Fran Hennessey for help making observations through the year; David Lee for providing additional observations from his weather station also in Llanfairfechan; and the Met Office at RAF Valley for sunshine data supplied from 1946 to 2011. Current data (provisional) are gathered from SYNOP reports.
|
|||||||||||||||||||||||||||||||||||||||||||||||||||||||||||||||||||||||||||||||||||||||||||||||||||||||||||||||||||||||||||||||||||||||||||||||||||||||||||||||||||||||||||||||||||||||||||||||||||||||||||||||||||||||||||||||||||||||||||||||||||||||||||||||||||||||||||||||||||||||||||||||||||||||||||||||||||||||||||||||||||||||||||||||||||||||||||||||||||||||||||||||||||||||||||||||||||||||||||||||||||||||||||||||||||||||||||||||||||||||||||||||||||||||||||||||||||||||||||||||||||||||||||||||||||||||||||||||||||||||||||||||||||||||||||||||||||||||||||||||||||||||||||||||||||||||||||||||||||||||||||||||||||||||||||||||||||||||||||||||||||||||||||||||||||||||||||||||||||||||||||||||||||||||||||||||||||||||||||||||||||||||||||||||||||||||||||||||||||||||||||||||||||||||||||||||||||||||||||||||||||||||||||||||||||||||||||||||||||||||||||||||||||||||||||||||||||||||||||||||||||||||||||||||||||||||||||||||||||||||||||||||||||||||||||||||||||||||||||||||||||||||||||||||||||||||||||||||||||||||


