
Llansadwrn (Anglesey) Weather
Use and construction of a lysimeter to measure evapotranspiration


|
Llansadwrn (Anglesey) WeatherUse and construction of a lysimeter to measure evapotranspiration |

|
|
|
Most weather stations record rainfall but few measure evaporation despite it being an important parameter in climatology. What happens to rainfall once it has reached the ground also is of interest to ecologists, hydrologists and water engineers. With modern automatic instrumentation it is relatively straightforward to calculate evaporation and is done so by professional hydrologists and others. Some weather enthusiasts use the Piche evaporimeter exposed within their thermometer screen to measure evaporation. Evaporation can be measured, at a site which also measures rainfall, by using a lysimeter which gives additional information on soil water balance. This webpage describes the construction and use of the classical lysimeter and is based on an article by the author published in a Bulletin of the Climatological Observers Link.1
With the current interest in global climate change is it not a good time to increase the number of observations of evaporation, particularly by amateurs, weather enthusiasts and in schools? In recent issues of the Bulletin of the Climatological Observers Link there are only 2 or 3 observations from evaporation tanks and 5 or 6 from Piche evaporimeters in over 300 reporting stations. I suspect that lack of interest is not a factor, but is one of practicability or cost of equipment. Evaporation tanks or pans are expensive, even if space was available at the average weather station. The Piche evaporimeter is more popular, but can be subject to frost damage and observations (usually mls of water evaporated) are not usually translated into data to compare with rainfall. The lysimeter, measuring potential evapotranspiration, is an apparatus which can be constructed from readily available do-it-yourself (DIY) materials for less than £30 ($45). If you like a hands-on approach and like making things then read on, this is for you.
Potential evapotranspiration
Potential evapotranspiration (PE) is what would be evaporated from a surface if water was never a limiting factor. PE can be calculated using empirical formulae, from the simple needing only temperature, to complicated ones requiring several observations (eg that of Penman2 or Thornthwaite 3 were among the first). 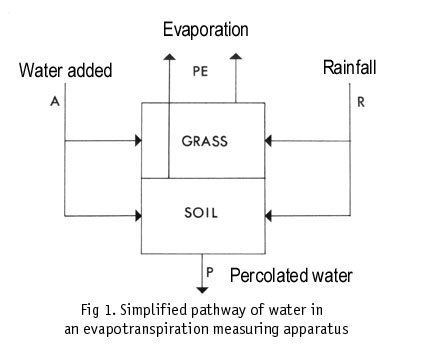 Alternatively PE may be calculated as the difference between two easily measurable quantities. These quantities are the input and output of water in a system, which may be anything from a large water catchment area to a small container. Among the earliest attempts to measure evaporation were those of Dr Dobson in Liverpool between 1772 and 1775. Dr Dobson used two well-tarnished tin vessels of 12 in (30 cm) diameter; one of which was to serve the purposes of a raingauge and the other an evaporating vessel. A Mr J Dalton and his friend Thomas Hoyle made observations, from 1795 to the turn of the century, of the water balance of England and Wales. They used an apparatus resembling a transpirometer, for measuring evaporation (transpiration) of plants. These methods all involve measurement of evaporation by difference, the subtraction of one quantity from another. Early observations were somewhat inaccurate and difficult to interpret, but in the 1960's, the late Frank Green did much to standardise the method and set up a national network of stations measuring PE. In 1972 at least 19 stations were being operated by staff of the then Nature Conservancy, 7 by other organisations and 6 in Ireland. From 1958 data were published for several years in British Rainfall. Green's lysimeter was made from two 40 gallon oil drums, 22 in diameter. One drum cut in half was the tank the other, full size, the receiving vessel. Some of these stations may still be operating such as the one built in 1963 by Father Ambrose Lambert at Downside Abbey. The metal drums, although painted with bitumastic paint, tended to rust and eventually leaked if the soil was acidic particularly in peaty sites in mountain areas.
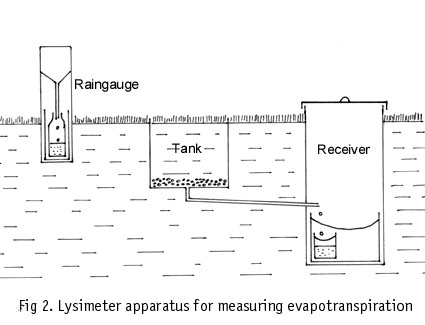
The measurement of PE (Fig. 1) includes that moisture evaporated to the atmosphere from plants and soil. If the soil is kept moist (at or near field capacity so that water is not limiting) by the addition of water, and well covered by vegetation (a grass sward is ideal) evapotranspiration is controlled by the weather and is largely independent of the amount (biomass) of the vegetation. If the soil and vegetation is confined within a small tank (the lysimeter) and measurements are made of the water input (Rainfall R and Additional water A) and output (Percolated water P) collected in the receiver (Fig. 2), then PE can be estimated from the equation:
| PE = R + A - P |
 |
A criticism of this is that the result is dependant on the catch of rainfall by the raingauge which, usually at standard height above ground, may not be that received by the lysimeter at ground level. PE may therefore be inaccurate by the same amount as the rainfall is inaccurate. If both apparatus are similarly exposed, and particularly not overexposed, then reasonable results can be expected. (A ground level gauge could be used to try and obviate this criticism, but there are problems with these gauges as well). The difference between the water percolated and the water added (P - A) is the Potential Water Balance (PWB). Both P and A are accurate measurements which are independent of the rainfall measurement. Potential Water Surplus (PWS) and Potential Water Deficit (PWD) can be estimated from the same difference sum. If the answer is positive it is PWS and if negative it is PWD. The Potential Water Balance (PWB) is the arithmetic sum of PWS and PWD or, more simply, P - A. These values are useful in their own right for correlating with plant growth and calculating run-off. Depositions of water as dew or frost although not measured are effectively incorporated in the overall result. During extremely dry weather when the ground surrounding the lysimeter is dried out values of PE will be abnormally high. This 'oasis effect' is, however, common to the tank and Piche methods. |
|
|
Materials: The lysimeter was made from readily available materials (Table 1). The tank was a black plastic builders' bucket (30 cm diameter and 25 cm deep). Choose the type which does not have a spout. The buckets are slightly tapered, vertical sides would be preferable. The black plastic used appears to be stable in light. I have had several in use in the garden and exposed to light for many years without deterioration (some plastics will become brittle exposed to light). The receiving vessel was a discarded plastic 25 litre emulsion paint container (30 cm x 42 cm). The size (depth) of the tank and run of drainage pipe will determine the depth required for the receiver. The receiver must be deeper than the tank and be capable of holding the largest rainfall you can expect at your site. Sufficient space must be available in the bottom to allow collection of the percolated water. Another discarded container (5.5 litre capacity), holding about 80 mm rainfall, forms a large collecting vessel. While any size container for the tank could be used, with appropriate calculations, the 30 cm tank has proved satisfactory. If you have the space and can excavate larger holes in the ground it would be possible to use some types of plastic waste bins. I chose brass compression joints for the plumbing because I preferred a mechanically strong joint (these and the alkathene pipe are used for domestic water supply and last in the ground for years). It is possible that some of the newer plastics available for domestic piping (not waste pipes) also would be suitable.
Table 1. Parts list for construction of a small lysimeter
You may find that some other combination of plumber's fittings will do the same job, ask at your builders merchant or DIY store if in doubt.
Tools required: Adjustable spanners (2 necessary) for tightening the brass joints, a hand drill and tank cutting bit (I used the serrated type) and a small saw to cut the alkathene tube and the top of the bucket.
Assembly: Remove the handle of the bucket and carefully cut off the top lip with a saw ensuring a straight cut. A drain tube was made from 19 mm OD alkathene tube, connections were brass compression joints (Figure 3).
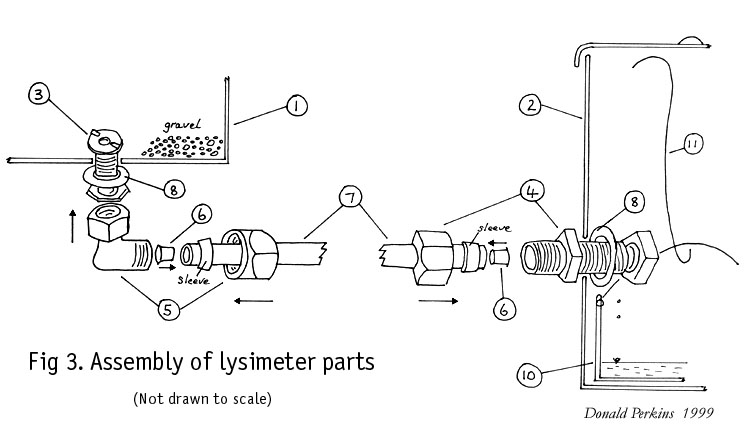 |
Check over the brass connectors, note that compression joints contain a brass sleeve. Try fitting them loosely together to gain familiarity with assembly. Assemble the tank first. Cut the hole in the bottom (use smallest cutter which will allow entry of the tank connector). Assemble joints (due to thinness of the plastic tank you need washers) smear surfaces with a joint sealer, tighten using 2 spanners. Do not over-tighten compression fittings, usually a 1/5th turn after being first tight is sufficient if all parts are of the correct size. I used a few turns of PTFE tape to connect the elbow (item 5) to the tank connector (item 3). Test for leaks by filling the supported tank 1/3rd full of water after raising the end of the pipe above the intended water level. It would be difficult to test for leaks after installation. The hole in the receiver cannot be made until the excavations have been completed and the pipe levels adjusted. It is important that this entry is also well sealed to prevent entry of water if ground becomes waterlogged. Again test for leaks before filling in with soil. If using a tightly fitting lid leave an air gap by keeping the hook (11) suspended under the lid. Exposed parts of the receiver could be painted with an opaque gloss paint to minimize deterioration of the plastic in sunlight.
|
|
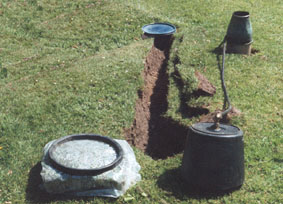 Decide on the location (choose a level piece of ground) near but not too close to the raingauge. Cut and remove the turf. Select a good piece for the lysimeter, keep to one side and do not allow it to dry out. Holes were excavated to receive the tank and receiver and a narrow trench dug between. Distance apart is not important (suggested minimum 2 m). There should be a slight fall between tank and receiver to allow drainage. Remove the soil leaving the bottom on which the tank rests undisturbed so that sinking will be minimized. Place the tank in position and level off about 1 cm above the surrounding soil surface packing underneath if necessary. Place some small stones around the drain hole and cover with 2-3 cm of 0.5 cm gravel. Use the cut off top of the bucket as a template to shape the piece of turf to be used for the lysimeter. While any soil can be used to fill the tank, a moderately free-draining soil is best; heavy clay or peaty soils may not be suitable. I used the local soil which is a moderately draining brown earth.
 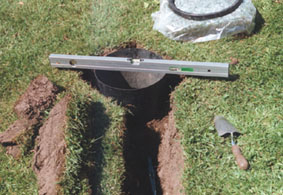 The turf should have a good growth of grasses (or cover of the local vegetation), and associated species which may include moss, so that when looked at from above hardly any soil can be seen. Pack the tank above the gravel and below the turf with soil. Arrange that the turf inside the tank is a minimum of 2 cm below the lip but at the same level as the surroundings. In areas subject to high and/or intense rainfall the soil level should be proportionally lower. I found it useful to use strips of strong polythene sheet (c 10 cm x 100 cm) for support when trial fitting the turf. This enables removal for addition of more soil if the initial level is incorrect. The receiver is best placed with its top about 5 cm above ground so that surface water cannot enter. Pack soil around the apparatus, relay turf and apply water to bed in the turf and settle the soil when construction is complete. Measurements can begin in a few days. Within a few weeks my lysimeter was indistinguishable from the surrounding grass sward and giving reliable results. I have had to mark its position with small pegs to enable it to be easily located! The grass is cut with a hover mower, usually weekly during the growing season, a height of 3-5 cm above soil surface is ideal.
|
|
Measure the water percolated P in mls at the same time as rainfall (09 GMT in the UK). An amount of water A should be sprinkled on to the lysimeter such that there is some percolation (50 to 100 mls) each day. The amount necessary will vary according to the time of year and weather conditions. In dry weather more will be required to maintain an adequate soil moisture level. If necessary more water can be added later in the day if the amount of percolated water is inadequate. If significant rainfall has occurred, and percolation is taking place, it may be unnecessary to add water. Percolated water can be recycled to minimize loss of nutrients. Record the condition of the grass surrounding the lysimeter: 0 = hardly any difference; 1 = less growth, almost as green; 2 = much less green; and 3 = brown and parched. If covered with snow, or if frozen, the lysimeter should be left to thaw naturally, any percolate should be measured in the usual way but do not apply irrigation water.
British rainfall measurements usually are made in a standard 5 in (127 mm) diameter gauge, although other diameters are in use. Rainfall observations are now returned as mm of rain, previously inches were used. The calculations below are based on the 5 in standard British gauge and the modern mm measurement. The calculations with modification could be used determine factors for any size of raingauge and lysimeter tank.
Percolate volumes to mmThe amount of water added A and percolate P must be converted to give standard readings in mm, as for rainfall. The best method is to use a laboratory type measure calibrated in litres and subdivided by 5 ml increments to measure the water added and percolate in mls and then apply a conversion factor. If unavailable you could use a kitchen measure calibrated in litres and mls for large volumes and/or a standard 5 in raingauge measure for smaller. Conversion factors are, however, necessary. To find the dividing factor to convert mls to mm calculate the area of the tank in cm2 and divide by 10. Thus for a 30 cm diameter tank of radius (r) of 15 cm
To convert standard 5 in raingauge measures (mm) to read percolate from a 30 cm diameter lysimeter (mm) calculate the dividing factor as area (cm2) of lysimeter/ area of raingauge
Therefore, 10 mm and 50 mm rain measures will hold respectively 1.8 mm and 8.9 mm of lysimeter percolate. In both cases a look-up table using the above factors could be constructed instead of calculating.
Calculation of PEPrepare a record as shown in the example in Table 2. The values should be thrown back to the previous day to correspond with rainfall. I use a spreadsheet for entry of daily readings of water added, rainfall and percolate. The spreadsheet does all the calculations necessary and produces monthly and annual totals. It can also be used to calculate PWS, PWD and PWB.
___________________________________________________________________________________________

      Table 2. Example extract from spreadsheet showing the daily lysimeter readings
             for part of April 1977 at Llansadwrn, Anglesey
___________________________________________________________________________________________
      Water added   +   Rain  =  Total     Percolate       PE     PWS    PWD    PWB  Grass
    *(mls)   (mm)       (mm)     (mm)    *(mls)   (mm)    (mm)   (mm)   (mm)   (mm)  cond.
___________________________________________________________________________________________

 1     300    4.2        4.2      8.4       290    4.1     4.3          -0.1   -0.1      0
 2     290    4.1       10.7     14.8       680    9.6     5.2    5.5           5.5      0
 3       0    0.0        1.5      1.5       130    1.8    -0.3    1.8           1.8      0
 4     130    1.8        4.3      6.1       370    5.2     0.9    3.4           3.4      0
 5     200    2.8        7.8     10.6       408    5.8     4.9    2.9           2.9      0
 6       0    0.0        3.7      3.7       318    4.5    -0.8    4.5           4.5      0
 7     318    4.5        0.0      4.5       230    3.3     1.2          -1.2   -1.2      0
 8     300    4.2       14.7     18.9       680    9.6     9.3    5.4           5.4      0
 9       0    0.0        0.3      0.3       153    2.2    -1.9    2.2           2.2      0
10     153    2.2        0.4      2.6       115    1.6     0.9          -0.5   -0.5      0
11     250    3.5        0.6      4.1       175    2.5     1.7          -1.1   -1.1      0
12     250    3.5        2.1      5.6       190    2.7     2.9          -0.8   -0.8      0
 .      .      .          .        .         .      .       .      .      .      .       .
___________________________________________________________________________________________

Apr   6884   97.4       83.3    180.7      7882  111.5    69.2   34.0  -19.9   14.1      -
___________________________________________________________________________________________

* For a 30 cm diameter tank volume (mls) is divided by 70.7 to obtain mm
|
Over a long period any variation in the amount of water stored in the soil in the tank can be ignored. Over short periods variation in soil water can affect the result. This is another reason why observations over one to a few days are inaccurate. There are designs of lysimeter in which the tank is weighed daily and more accurate short-term measurements are possible taking into account the amount of stored water. A graphical method of making some allowance for variation in water storage was proposed by Green (1960). If the apparent PE is plotted cumulatively against time and a smooth curve drawn through points where daily percolate and the apparent PE are similar then daily values of PE can be obtained somewhat more accurately. This is only necessary if you want to estimate weekly values and/or rarely there is a problem at the beginning and end of a month.
|
|
I have had to do very little except cutting the grass. Autumn and Spring are good times to do any necessary maintenance such as checking on the soil levels of tank and surrounds. Finely sifted soil can be used to raise the level but the only way to lower the level is to cut out the turf adjust and relay. My levels were satisfactory but some grasses and moss tend to grow over the lip of the tank. I carefully cut around the tank to prevent this and repeat when necessary. Eventually it will be necessary to re-adjust the level. Although it is recommended that the percolate is used for irrigation there may still be a loss of nutrients, which in some soils could be a problem. A weak liquid fertilizer could be added, if necessary, to maintain good growth which should be comparable to that of the surrounding area. Sometimes an impervious layer may develop in some soils. If it is suspected that drainage is becoming slow the soil should be carefully prodded in several places with a stiff length of wire or thin pronged garden fork.
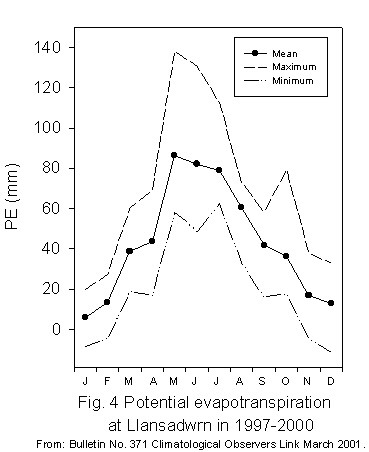
Records of PE at Llansadwrn began in May 1996. Observations are published monthly in the Bulletin of the Climatological Observers Link and on these webpages. Some data (Fig. 4) were presented in the Bulletin of the Climatological Observers Link 5. The figure shows the month-by-month PE between 1997 and 2000; the upper and lower curves show the maximum and minimum values recorded, while the central curve shows the monthly mean values. Mean monthly PE varies from 6 mm in January to 86 mm in May. The highest PE was 138 mm recorded in May 1999. The annual mean for the 4 years was 517 mm; the highest was 675 mm in 1988 and the lowest 249 mm in 2000.
|
Sometimes negative values appear in the months November to February. There are 2 mains reasons why these occur, both because of the net calculation. First, the method depends on an accurate rainfall measurement and what is measured in the raingauge may not be that which reaches the lysimeter. This can be obviated by having a ground level gauge that in some locations can measure of the order of 5% more rainfall. Secondly, the lysimeter also collects dew and melted frost that the raingauge does not. A combination can account for the negative values at a time when PE is low. During months when PE is larger the relatively smaller rainfall inaccuracy and dew depositions are not easily seen in the monthly data.
![]() Monsieur Albert Piche's Evaporometer
Monsieur Albert Piche's Evaporometer
I would be interested to hear from anyone who is operating, or is interested in setting up, this 'classic' apparatus You can write here
|
|
These pages are designed and written by Donald Perkins © 1999 - 2006Document dated 18 August 1999. Last updated 28 January 2006.http://www.llansadwrn-wx.co.uk |