|
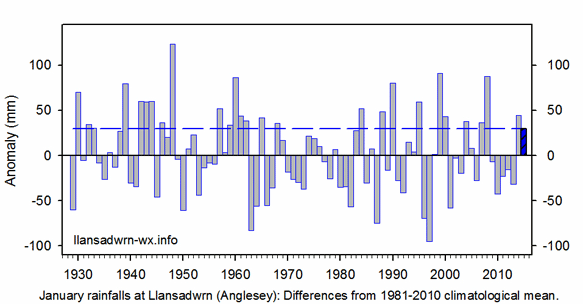
January 2015A traditional January, wet, windy, hail and snow, temperatures below averageWet with gales at the beginning, turning colder with hail and snow middle of the month Back to January again, the years seemingly turning around very quickly. After the warmth of 2014 expectations of what the year will hold. Different to last January, that had above average temperatures, this January ended below average the first month since August 2014, the only month in 2014 to be so. There were 13 days with small hail, mostly snow pellets, (+7.4) days of average, and 4 days with snow falling (+0.6) of average. There were no days with snow lying although there was one day when the ground was covered with snow for a while, but not at 0900 GMT. The mean temperature 4.9C (-0.5) & [-0.3] of averages, was lowest since 2013 ranking 14th since 1979. The mean maximum was 7.4C (-0.3) & [-0.2] of averages, highest 12.6C in the Stevenson screen on the 9th. The lowest maximum 3.3C [+0.5] on the 21st was one showing a positive anomaly. The mean minimum 2.3C (-0.6) & [-0.3] of averages. The highest minimum was 8.0C (-0.8) on the 1st and the lowest -1.5C on the 19th was lowest since 2011. There were 6 (+0.4) air frosts and 25 (+10.0) ground frosts. The lowest ground frost was -6.6C recorded on the 18th. There were 15 consecutive days, 11th to 27th, with ground frosts. There were no air frosts at Gorwel Heights, but 3 were recorded at Gorddinog. The mean temperature 5.9C (+1.0 compared with Llansadwrn) was [-0.3] of average, the same mean 5.9C at Gordinnog. Highest maxima were 14.9C at Gorwel Heights and 15.1C at Gorddinog on the 9th. The lowest minima were 0.2C at Gorwel Heights and -1.0C at Gorddinog both on the 20th.
At Gorwel Heights wind gusts of 50 mph or over were 4 (1st, 7th & 8th, and 14th that was the highest 56 mph). Two days had 49 mph (9th & 10th). The mean wind speed was 6.1 mph (highest 15.7 mph on the 1st. Llansadwrn did not have the impressive gusts (highest 47 mph on the 10th), but had higher mean wind speed 8.5 mph, highest 20.2 mph on the 15th Evaporation by lysimeter was 28.9 mm and by Piche evaporimeter 28.6 mm, the calculated value lagged behind on 16.8 mm.
February 2015Below average temperatures and rainfallCold with air frosts and snow at the beginning, somewhat wetter middle and end In contrast to 2014, that began stormy, very mild and wet, this year and February has been more traditional with below average temperatures and days of snow. While January was wet, February was drier and with below average precipitation. Beginning with precipitation, the total was 50.8 mm (73%) & [65%] of averages. The largest fall was just 13.0 mm on the 25th, the only day to see more than 10 mm. There were 8 days(+2.7) with no precipitation and 13 dry days (+2.4). Rain days were 15 and this number was (-2.6) of average. Wet days were 8 (-3.5) and the 5 days with 5 mm, or more, the only statistic to be above average (+0.7). Gorwel Heights was drier having 32.4 mm [42%] of average and here the wettest day was 11.6 mm on the 25th. There were 48 wet hours duration recorded compared with the 74 hours in Llansadwrn.
In Llansadwrn snow fell on 3 days and was lying on 2 days at 0900 GMT. Snow was 3 cm deep on the 2nd and 2 cm on the 3rd, snow lasted on the ground for another 2 days; on the 4th snow was was 0.5 cm, but <50% cover. Some remnants remained on the 5th. Small hail, mostly snow pellets, fell on 7 days (+1.7). Evaporation by lysimeter (PE) was 18.3 mm, 17.6 mm (ET) calculated by the AWS and 26.1 mm by the Piche evaporimeter. Sunshine at Valley: SYNOP data were incomplete with observations not reported on the 27th and 28th; the 1 - 3 of March were also not reported. Up to the 26th there were 77.6h and with an estimated 4.4h on the 27th and 0.2h on the 28th, following examination of observations from neighbouring stations, brought the total to 82.2h (103%) & [102%] of averages. There were an estimated 6 sunless days. Winter 2014/15Temperatures a little below average; rainfall near average; air frosts continue downward trend The mean temperature 5.1C (-0.3) & [-0.1] of averages, was lowest since 2013 and ranked 15th since records began in 1979. Winter rainfall totalled 308.1 mm (99%) & [102%] of averages, lowest since 2012, but still ranking the 38th largest total since records began in Llansadwrn in 1929.
Air frosts 
The number of winter air frosts were nil in December with 6 each in January and February of 2015, a total of 12. Records suggest an average reduction (by regression) of 18 over the 36 winters' observations the inverse of the increase of 1C in annual mean temperatures . The decline of frosts was most marked to winter 2007/08, after a return to colder winters in 2009/10 and 2010/11 numbers increased. Subsequent winters, including 2013/14 and 2014/15, continued the overall decline in air frosts. Days of ground frost recorded since 1985/86 have not declined in the same way, and may have increased. The non-significant regression suggests an increase of 13 days, from 36 to 49 days, over the 30 winters. March 2015Cooler and drier than average in recent years, and sunnierMixed, cool with sleet and hail, wet and a bit warmer turning cooler and drier again before a wet end to the monthGenerally cool with lower than average maximum temperatures the mean 9.6C (-0.6) & [-0.7] the highest on the 11th & 12th 11.9C (-4.9) of the decadal average. Minima were also below average, but but not as much. The mean minimum 3.1C (-0.4) and [-0.5] with the lowest 0.1C (+1.6) on the 24th. The mean was 6.4C, lowest since 2013 ranking 12th since 1979. There were 17 (+3.8) ground frosts with the mean grass minimum 0.1C (-0.7) and the lowest -4.5C on the 9th. Sleet was observed on the 1st & 2nd and there were 6 days with small hail (-0.6). At Gorwel Heights the mean temperature was 7.2C (-0.2). The mean maximum 9.8C with the highest 15.0C on the 7th in a sustained Föhn-wind when a temperature of 18.6C was recorded in the nearby village Dwygyfylchi these representing an enhancement of 5.8 degrees and 9.4 degrees on the Llansadwrn temperature of 9.2C at the same time. The mean minimum at Gorwel Heights was 4.6C with the lowest 1.8C on the 14th. Rainfall in Llansadwrn was 74.7 mm over 90 wet hours duration, lowest since 2013, (107%) of the decadal average, 105% of the long-term average {1928-2014}, but 88% of the climatological 1981 - 2010 average. The wettest day was on the 12th having 18.5 mm while 10.3 mm fell on the 28th and 13.4 mm on the 30th. There were 6 days with no precipitation (-2.5) and 16 dry days (+1.3) there were 6 days with trace amounts. Rain days were 15 (-1.3) and wet days were 12 (+0.2). The 3 days with >5.0 mm were (-1.9). The last really wet April was in 2006 with 139.9 mm. Rainfall at Gorwel Heights was 62.2 mm [72%] and the wettest day 17.2 mm on the 12th. Wet hour duration was 59h and rain days 14, wet days 10 with 4 days having >5 mm. There were 17 dry days when <0.2 mm was recorded. There were no readings available at Valley for sunshine on the 1 - 3rd of the month. To get an estimate of the months, as at the end of February, daily figures for missing days were derived from comparisons of nearby stations. The estimated total sunshine was 148.2 h (113%) & [131%] of averages (131.2 h was reported for 4 - 31st). The sunniest day with 11.5 h was on the 21st and a probable 4 sunless days as the first 3 days were sunny. It was cloudier in Llansadwrn where 7 days were sunless, the highest global solar radiation was on the 21st with 14.44 MJ m -2 the brightest hour was between 12 & 13 GMT with 630 w per m-2 . April 2015Sunny, near average temperatures with below average rainfall, windy at timesA wet beginning then dry in the middle of the month with a cold and frosty at the end
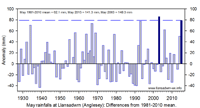
Precipitation was below average in Llansadwrn the 41.7 mm (67%) & [66%] of averages. Wetter at Gorwel Heights the 60.8 mm [97%] of average. The wettest days were on the 1st in Llansadwrn when 12.0 mm fell and at Gorwel Heights 16.6 mm were recorded. Rainfall duration (wet hours) corresponded closely with 62 in Llansadwrn and 60 at Gorwel Heights, an indication that precipitation was heavier at Gorwel Heights over a similar time scale. There were 13 days (+2.1) with no precipitation in Llansadwrn and 18 (+3.1) dry days at both stations. Rain days were 12 (-3.1) in Llansadwrn and Gorwel Heights. Wet days in Llansadwrn were 7 (-3.4) while there were 10 at Gorwel Heights and days with 5 mm, or more, were 3 (-1.2) in Llansadwrn and 4 at Gorwel Heights. Evaporation measured by lysimeter in Llansadwrn (PE) was 50.6 mm with a PWD (potential water deficit) of -26.8 mm and a PWB (potential water balance) of -8.9 mm. The soil surface was recorded at 0900 GMT as being dry on 12 mornings; soil was observed to be cracked on 5 mornings. At the end of the month soil moisture under grass was 59% dm and on the bare met plot 33% dm. Temperatures were close to average with the mean at Gorwel Heights 9.5C [+0.5]. In Llansadwrn the 8.9C mean was (-0.4) and [0.0] of the averages. Highest maxima were 20.1C (+1.4) in Llansadwrn and 20.3C at Gorwel Heights on the 10th. Lowest minima on the 27th were -0.1C in Llansadwrn and 2.4C at Gorwel Heights, the latter having a lower 2.3C on the 6th when it was 1.1C in Llansadwrn. There were 10 (+3.0) ground frosts in Llansadwrn, lowest recorded was -4.7C on the 27th. May 2015Cool and wetWettest at the beginning, a very cool middle, 2 reasonable days and not much better by the end
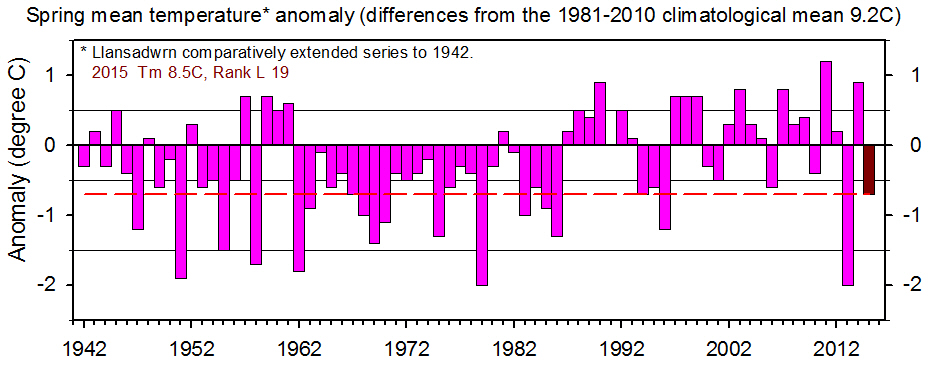
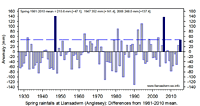
Sunshine recorded at RAF Valley was 185.1 h lowest since 2013 and (92%) & [95%] of averages. The sunniest day was on the 16th with 12.7h and there were 2 sunless days. Spring 2015
June 2015Cool, dry and very sunnyWet day at the beginning then very dry. A surprise hot summer day right at the end.A dry month after the 24.0 mm that fell on the 1st. Total for the month was 41.6 mm (57%) & [62%] of averages, lowest since 2006 and ranking 21 since 1928. Rainfall at Gorwel Heights was 32.4 mm with the largest fall 18.4 mm on the 1st [49%] of average. In Llansadwrn there were 13 days without any precipitation (-0.2) and dry days were 18 (+2.2). Rain days were 12 (-2.2) and wet days 7 (-3.9). Bucking the trend in recent years there was only 1 day with 5 mm, or more (-3.8). At Gorwel Heights there were 20 dry days; 10 rain days and 2 with 5 mm, or more on the 1st and 19th. Duration of rainfall was 59 h in Llansadwrn and 40 h at Gorwel Heights with the average rain per hour 0.8 mm and 0.7 mm respectively. Very sunny at RAF Valley with 238.7 hours (114%) & [139%] of K&Z adjusted averages lowest since 2013, but ranked 4th highest in June on the Anglesey record since 1931. The sunniest day was on the 9th with 15.7h and there was just one sunless day on the 17th with the 24th having only 0.3h. Temperatures were on the cool side of average for most of the month, only the 30th exceeded expectations with a maximum of 27.2C recorded just before 0900 GMT on the 1st July so counting, by meteorological convention, as the 30th of June. Gorwel Heights also recorded 27.3C and Gorddinog 27.1C at similar times on 1st July. The mean monthly temperature was 13.5C (-0.7) & [-0.4] of averages in Llansadwrn, equal lowest with 2013 since 2012. The lowest maximum was 11.1C (-1.9) on the 1st. The mean minimum was 9.7C (-0.9) & [-0.3] of averages, lowest since 2011. The highest minimum was 15.9C on the 30th and the lowest 5.4C (-0.7) on the 7th that also saw the lowest grass minimum of 2.3C (-0.6). Soil temperatures at 30 cm depth kept just below the average all month and finished with an average of 14.7 (-1.3).
July 2015A cool month with temperatures below average and rainfall above the 30-y average. Sunshine lowest since 2012.Began warm then cooled throughout the monthThe temperature on the 1st reached 27.2C before and just after 0900 GMT. This was the highest of the month (+1.3) in what was a cooler than average July. The mean temperature 14.8C (-1.2) & [-1.0], was lowest since 2012 and ranked 10th lowest since 1979 and 23rd lowest since 1941. The mean maximum was 18.3C (-1.4) & [-1.2], the lowest maximum was 14.5C (-0.5) on the 29th. The mean minimum was 11.3C (-1.0) & [-0.7], the highest 17.8C (+1.6) on the 1st and lowest 7.2C (-1.6) on the 9th & 30th the latter also had the lowest grass minimum 3.5C (lowest in July since 2007). Earth temperatures too were below average, at 30 cm the mean 16.7C (-0.8C) and at 100 cm 15.2C (-0.8). Temperatures were higher in the microclimate at Gorwel Heights, but still below average, with the mean 15.7C [-0.4]. The month began fairly dry with the soil surface dry and finely cracked. Soil moisture under grass determined on the 10th was down to 36.8% dry mass and of bare soil on the met plot 20.9% dm just above the permanent wilting percentage of the local soil of 15.2% dm. Rainfall was 78.4 mm, largest since 2012 and 112% of the 1981-2010 average, but compared with the last decade July was drier (85%) of average. Four of these years were very wet 2007 120.4 mm; 2009 135.8 mm; 2010 182.1 mm; and 2012 109.4 mm. July 2006 was the driest with 26.1 mm. Soil moisture was partly restored reaching 54.8% dm under grass and 24.8% on the bare plot on 3 August. The July potential water balance (PWB), determined by lysimeter, was -3.1 mm with a potential evapotranspiration (PE) of 81.5 mm. The wettest day on the 6th had a modest total of 11.1 mm, least since 9.2 mm on the 29th 2003. Perennial plants did not exhibit wilting, but garden vegetables required some irrigation mid-month. There were 5 days with no precipitation (-5.9) and 8 dry days (-6.0). Rain days were 23 (+6.0) and wet days 16 (+2.4). Days having 5 mm, or more, were 5 (-1.0). It was wetter at Gorwel Heights the 93.0 mm [158%] of average. The wettest day was on the 18th with 12.0 mm. Dry days were 9; rain days 22, wet days 20 and 8 had 5 mm, or more. Wet hours were 109 with an average 0.9 mm per hour. In Llansadwrn wet hours were more 122 with a lesser 0.6 mm per hour average. SYNOP sunshine was unavailable at RAF Valley on the 1st, a value estimated from nearby stations was used to derive a provisional monthly duration of (187.9 h), lowest since 2012. The sunniest day was on the 15th with 15.0h with 6 more days having 10h, or more. There was 1 sunless day, but an additional 5 days had <1 h duration.
August 2015Drier and sunnier, but cooler than averageChangeable with some warm and sunny days, otherwise dull and damp, breezy at timesWith 65.0 mm of rainfall the month was drier than average just (67%) of the decadal and [75%] of the 30-year averages. Soil was recorded dry on 8 mornings and at the end of the month soil moisture on the met plot had fallen to 20.1% dm. Vegetables needed irrigation to maintain growth. Under grass soil moisture was higher on 49.4% dm. The generally small amounts of well distributed rain resulted in the grass looking green throughout. Potential evaporation, measured by lysimeter, was 56.5 mm resulting in a water balance of 8.5 mm. There were 5 days (-2.4) with no precipitation and 12 dry days (-0.1). Rain days were 19 (0.1) and wet days 14 (+1.1). Days with 5 mm, or more, numbered 3 (-2.6) with the wettest day on the 23rd with 12.3 mm. Wet hour duration was 92 and the mean rate of fall 0.7 mm/h Rainfall at Gorwel heights was 83.0 mm [98%] of average, this made up largely by the large fall 27.2 mm, over 5 hours duration, in the early hours of the 1st September that by convention is credited to the 31st August. The heaviest rate of fall was 129 mm/h at 0515 GMT. Dry days in the month totalled 13 and there were 16 rain days. Wet days were 11 and days with 5 mm, or more, 5. Days over 10 mm were: 12.2 mm on the 13th; 11.0 mm on the 22nd; and the 27.2 mm on the 31st. Wet hour duration was 79 and the mean rate of fall 1.1 mm/h. August was a little warmer on the averages with the mean temperature 15.2C (-0.1) & [-0.4] of averages. The mean maximum was 18.5C (+0.3) & [-0.7] of averages with the highest 21.6C on the 20th. There were just 4 days that had 20C, or more. The lowest maximum was 15.7C (+1.4) on the 17th. The mean minimum was 11.8C (-0.5) & [-0.2] of averages with the highest 15.5C on the 21st and lowest 7.7C on the 15th that also had the lowest grass minimum of 3.9C (-0.8). The earth temperature at 30 cm averaged 16.1C (-1.0) while at 100 cm the mean was 15.2C (-1.1). At Gorwel Heights the mean temperature was 16.0C [-0.1] of average. The highest maximum was 24.5C on the 20th and the lowest minimum 10.0C on the 15th. A sunny month at Valley with (204.1h) duration, most since 1995 and raking 6th on the Anglesey record (K&Z adjusted values) since 1931. Sunniest day was the 17th with 13.3 h and 2 sunless days were reported. Much more cloudy in Llansadwrn in close proximity with the N-facing slopes of the Snowdonia Mountains, with 7 sunless days. The brightest days in Llansadwrn were on the 12th, when solar radiation was 23.10 MJ m -2 and on the 8th 23.09 MJ m -2 . The brightest hour between 12 & 13 GMT with 839 w per m-2 . was also on the 8th. Summer 2015Summer rainfall 185.0 mm, lowest since 2006, and ranked 23rd lowest in Llansadwrn since 1928. Summer on the cool side with the mean temperature 14.5C, lowest since 2012, ranked 11th lowest at the station since 1979.
September 2015Sunny with below average rainfall and temperatureWet and windy in the middle of the month Another record sunny month. Sunshine duration recorded at RAF Valley was 187.8 h (144% & [147%] of averages, most in September on the Anglesey record (K&Z adjusted values) since 1931. The sunniest day was on the 21st having 12.0 h. There were no sunless days. A drier than average month. In Llansadwrn rainfall was 68.8 mm (70%) & [72%] of averages, lowest since 2013 ranking 23rd since 1928. Largest fall was 16.2 mm on the 14th with falls of 10.0 mm on the 1st and 13.6 mm on the 20th. No precipitation was recorded on 12 (+2.7) days and there were 15 (+5.7) dry days. Rain days were 15 (-1.3) and wet days 9 (-2.9). Days with 5 mm, or more, were 6 (-0.2). At Gorwel Heights rainfall was 44.2 mm with the wettest day 16.0 mm on the 14th and missing out on the heavier falls on the 1st (5.0 mm) and 20th (5.8 mm). There were 18 dry days and 12 rain days. Wet days numbered 10 and there were just 3 days having 5 mm, or more. Rainfall duration in Llansadwrn was 61h, at an average intensity of 1.1 mm/h, and 62 h at Gorwel Heights, at an average intensity of 0.7 mm/h. Temperatures were lower than average. The mean temperature in Llansadwrn was 13.1C (-1.0) & [-0.7] of averages, lowest since 2012 ranking 8th since 1979. The mean maximum was 16.8C (-0.3) & [-0.5] of averages. The highest were 21.3C (-1.4) on the 10th and 21.2C on the 11th The mean minimum was 9.3C (-1.7) & [-1.0] ranking 5th lowest since 1979. The lowest grass minimum was 2.7C on the 23rd. At Gorwel Heights the mean temperature was 13.6C [-0.8]. The highest maximum was 20.9C on the 8th and the lowest minimum was 8.5C on the 16th. It was a mostly quiet month. Gorwel Heights had a run of windy days from the 8th to the 11th all having over 100 mph wind runs, highest 221 mph on the 11th when there was a mean wind speed of 11.8 mph. Thunder was heard on the 1st during a storm from 0319 to 0337 GMT.
October 2015A drier than average with temperatures just above the 30-y average. Sunnier than averageSome large falls of rain spread throughout the month, otherwise dry. The first month this year to have a positive mean temperature anomaly of [+0.6] based on the 30-year average although the decadal anomaly continued negative (-0.1). The mean temperature 11.4C was lowest since 2012 and ranked 12 since 1979. The highest maximum was 19.1C on 2 dates the 1st and 6th this (-1.0) while the lowest 10.7C (+1.0) was on the 24th. At Gorwel Heights the mean was 12.1C (+0.5) joining April in being the only 2 months so far with positive anomalies. The highest maximum was 21.0C on the 5th one of the highest in the UK on the day while the lowest 10.6C was on the 24th. The lowest minima were 5.0C (+1.1) in Llansadwrn on the 25th and 5.1C on the 14th, that also saw the the lowest minimum of 6.4C at Gorwel Heights. The lowest grass minim in Llansadwrn was was 0.1C on the 25th there being no ground frosts this month (-1.0). A fairly dry month for October with 70.1 mm recorded in Llansadwrn (48%) & [55%] of averages lowest since 2007 and ranking 13th lowest since 1928. Three days had >10 mm, the largest was 23.5 mm on the 20th with 16.5 mm on the 23rd and 12.3 mm on the 6th. There was no precipitation on 7 (-0.1) days and there were 15 (+5.3) dry days. Rain days were 16 (-5.3) and wet days 8 (-8.2). There were 4 days (-4.5) having 5 mm, or more. At Gorwel Heights rainfall was 62.4 mm [50%] of average with 20.8 mm falling on the 6th and 13.0 mm on the 20th. There were 17 dry days, 14 rain days; 7 wet days; and 4 had 5 mm, or more. Rainfall duration was 68 h in Llansadwrn and 68 h at Gorwel Heights both having an average fall of 1.0 mm per hour duration. Despite have 7 sunless days sunshine at RAF Valley totalled 105.2 h (112%) & [108%] of averages, highest since 2010. The sunniest day was on the 1st with 11.1h. November 2015Mild, very wet, very dull and very windyA fine and sunny start then downhill all the way, well what can you expect at this time of year! In a word wet. The 245.3 mm of warm rain was largest since 2007 and ranked 3rd in Llansadwrn since 1925. It was (199%) & [194%] of averages. There were no days with nil precipitation (-4.4) and no dry days (-8.2). Rain days were 30 (+8.2) and wet days 26 (+8.8) while days with 5 mm, or more, were 17 (+8.8). The wettest day was on the 8th having 25.0 mm. Rainfall duration was 218 h with an average rate of fall of 1.1 mm/h. Shap Fell had 453 mm; Bala 304 mm and Sennybridge 297 mm. At Gorwel Heights rainfall was 184 mm [136%] of average. There were 2 dry days and 28 rain days. Wet days numbered 24 and there were 16 with 5 mm, or more. The wettest days was on the 6th with 23.6 mm. Rainfall duration was 181 h with an average rate of fall of 1.0 mm/h. Mild. The mean temperature was 9.5C, (+1.0) & [+1.8] of averages, was highest since 2011 and ranking 3rd highest with 1994 in 2nd place. The highest maximum was 17.0C on the 1st and the lowest 6.3C on the 21st. The highest minimum was 12.8C on the 11th and the lowest 1.1C on the 23rd that also had the lowest grass minimum of -3.6C. There were 6 ground frosts, but no air frosts. At Gorwel Heights the mean temperature was 10.3C [+1.5] of average. The highest maximum was 17.8C on the 6th and the lowest 6.7C on the 21st. The highest minimum was 13.8C on the 11th and the lowest 2.7C on the 21st. There were no air frosts. Dull. There were 16 sunless days in Llansadwrn and many of these were very dull indeed. The dullest was 9th with just 0.36 MJ m -2 while the brightest was on the 1st with 7.81 MJ m -2 . The mean solar radiation was 2.38 MJ m -2 lowest of the year. There were 13 sunless days at RAF Valley. Sunshine was 35.4 h (53%) & [62%] of average, lowest since 2004 and 7th lowest on the Anglesey record since 1931 (K&Z adjusted values). The sunniest day was on the 1st with 8.1h. Bala had just 28.8 h of sunshine while Jersey reported 56 h [69%] and Shannon 58 h [94%]. .Autumn 2014Autumn temperatures were above the 30-y average. Rainfall was a little above average and largest since 2012.
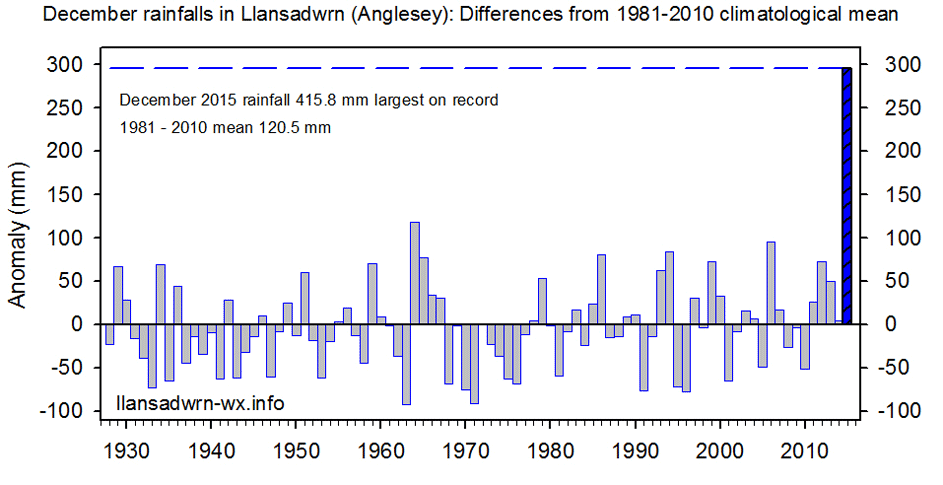
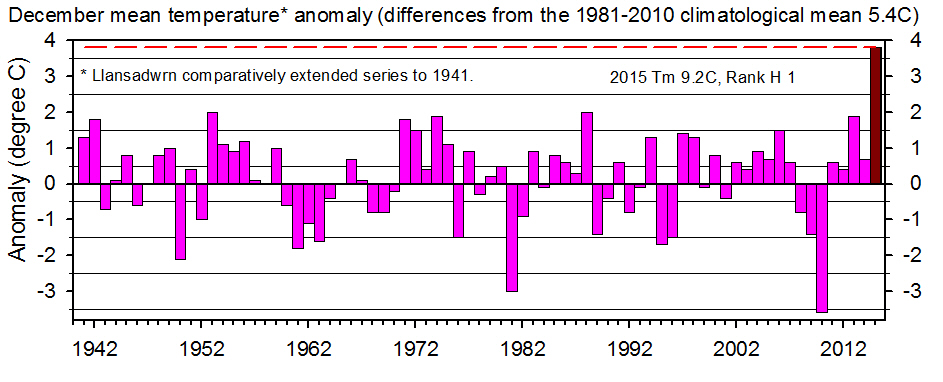
December 2015An extraordinary month of record rainfall and temperatures, but it was very dullWet, warm and very windy with odd cooler days Both rainfall and temperatures had seemingly completely anomalous statistics well outside observations over the last 90-years. Rainfall totalled 415.8 mm or 16.6 inches (310%) & [345%] of averages was the largest of any month on record in Llansadwrn since 1928. The largest fall 78.8 mm was on the 25th Christmas Day, was the largest December daily fall recorded at this station since 1979 greater than the previous largest 35.7 mm on the 10th in 2006. It was the second largest daily fall of any month exceeding the 86.0 mm of 22nd October 2004 and the 89.2 mm of 4th August 2013. Temperatures exceeded any recorded in December in Llansadwrn since 1979 and comparatively back to 1941. The record in Llansadwrn for the highest December maximum was exceeded twice, firstly on the 7th with 15.7C the again on the 27th when 16.1C was reached during Föhn wind events that do on occasion reach Llansadwrn. Llanfairfechan experienced several record Föhn events during the month with the highest were 17.7C at Gorwel Heights in a force 7 wind off the mountains with gusts up to 54 mph and 17.5C at Gorddinog (Stevenson screen) in gusts of wind up to 50 mph on the 7th for further analysis see my Diary ; and 17.9C at Gorwel Heights between 0240 and 0300 GMT in a force 5 gusting up to 38 mph and 17.4C at Gorddinog in gusts up to 35 mph on the 16th (was during the night on the 16/17th in absence of solar radiation with instruments well ventilated) amongst the highest in the UK. According to TORRO the previous highest recorded temperature on the 16th December was 17.0C at Aber in 1972. In Llansadwrn the mean temperature 9.2C (+3.7) & [+3.9] of averages was highest on record since 1979 and back to 1941 on my comparatively extended series. Wind A very windy month the mean wind speed at Llansadwrn was 11.4 mph, at Gorwel Heights 10.5 mph & Gorddinog 9.0 mph. Highest daily mws were Llansadwrn 28.0 mph on the 5th, Gorwel Heights 18.9 mph on the 5th. Highest gusts were Llansadwrn 58 mph on the 4th, Gorwel Heights 78 mph on the 30th, and Gorddinog 64 mph on the 30th. The wind in Llanfairfechan on the 30th was a severe event. At Gorwel Heights the wind was touching gale force 8 at each 10-min interval recorded between 0520 and 0800 GMT (for 2h 40m), the mean gust speed from 0340 to 0820 GMT was 58 mph (10-min intervals) with a high gust of 78 mph (a station record) at 0710 GMT; this wind caused structural damage to several houses in Llanfairfechan including houses at Gorwel. On 11 days gusts reached 50 mph, or more. On the 3rd 50 mph; 5th 54 mph; 7th 54 mph; 9th 57 mph; 19th 51 mph; 22nd 52 mph; 24th 50 mph; 26th 52 mph; 28th 59 mph; 29th 65 mph; and 30th 78 mph. . .Monthly data 2015
Llanfairfechan observations
AcknowledgementsThe Met Office at RAF Valley kindly supplied observational data from 1942 to 2011. Current data (provisional) are gathered from SYNOP reports and METAR. I am grateful to David Lee for use of data from Gorddinog and deputy observers Fran and Evan Hennessey for help making observations.
| |||||||||||||||||||||||||||||||||||||||||||||||||||||||||||||||||||||||||||||||||||||||||||||||||||||||||||||||||||||||||||||||||||||||||||||||||||||||||||||||||||||||||||||||||||||||||||||||||||||||||||||||||||||||||||||||||||||||||||||||||||||||||||||||||||||||||||||||||||||||||||||||||||||||||||||||||||||||||||||||||||||||||||||||||||||||||||||||||||||||||||||||||||||||||||||||||||||||||||||||||||||||||||||||||||||||||||||||||||||||||||||||||||||||||||||||||||||||||||||||||||||||||||||||||||||||||||||||||||||||||||||||||||||||||||||||||||||||||||||||||||||||||||||||||||||||||||||||||||||||||||||||||||||||||||||||||||||||||||||||||||||||||||||||||||||||||||||||||||||||||||||||||||||||||||||||||||||||||||||||||||||||||||||||||||||||||||||||||||||||||||||||||||||||||||||||||||||||||||||||||||||||||||||||||||||||||||||||||||||||||||||||||||||||||||||||||||||||||||||||||||||||||||||||||||||||||||||||||||||||||||||||||||||||||||||||||||||||||||||||||||||||||||||||||||||||||||||||||||||||


